Don’t Pretend AI “Knows”
A Recursive Lab for Visual Intelligence
AI generates semantic infinity with geometric poverty. Text-to-image models can produce any subject - figures to butterflies, cityscapes, portraits, abstracts - but arrange them using identical spatial strategies. This work is a deterministic diagnostics that measure structural behavior in generative systems, enabling evaluation against concrete metrics rather than subjective similarity.
Empirical evidence across studies:
27 - 34% of horizontal space used
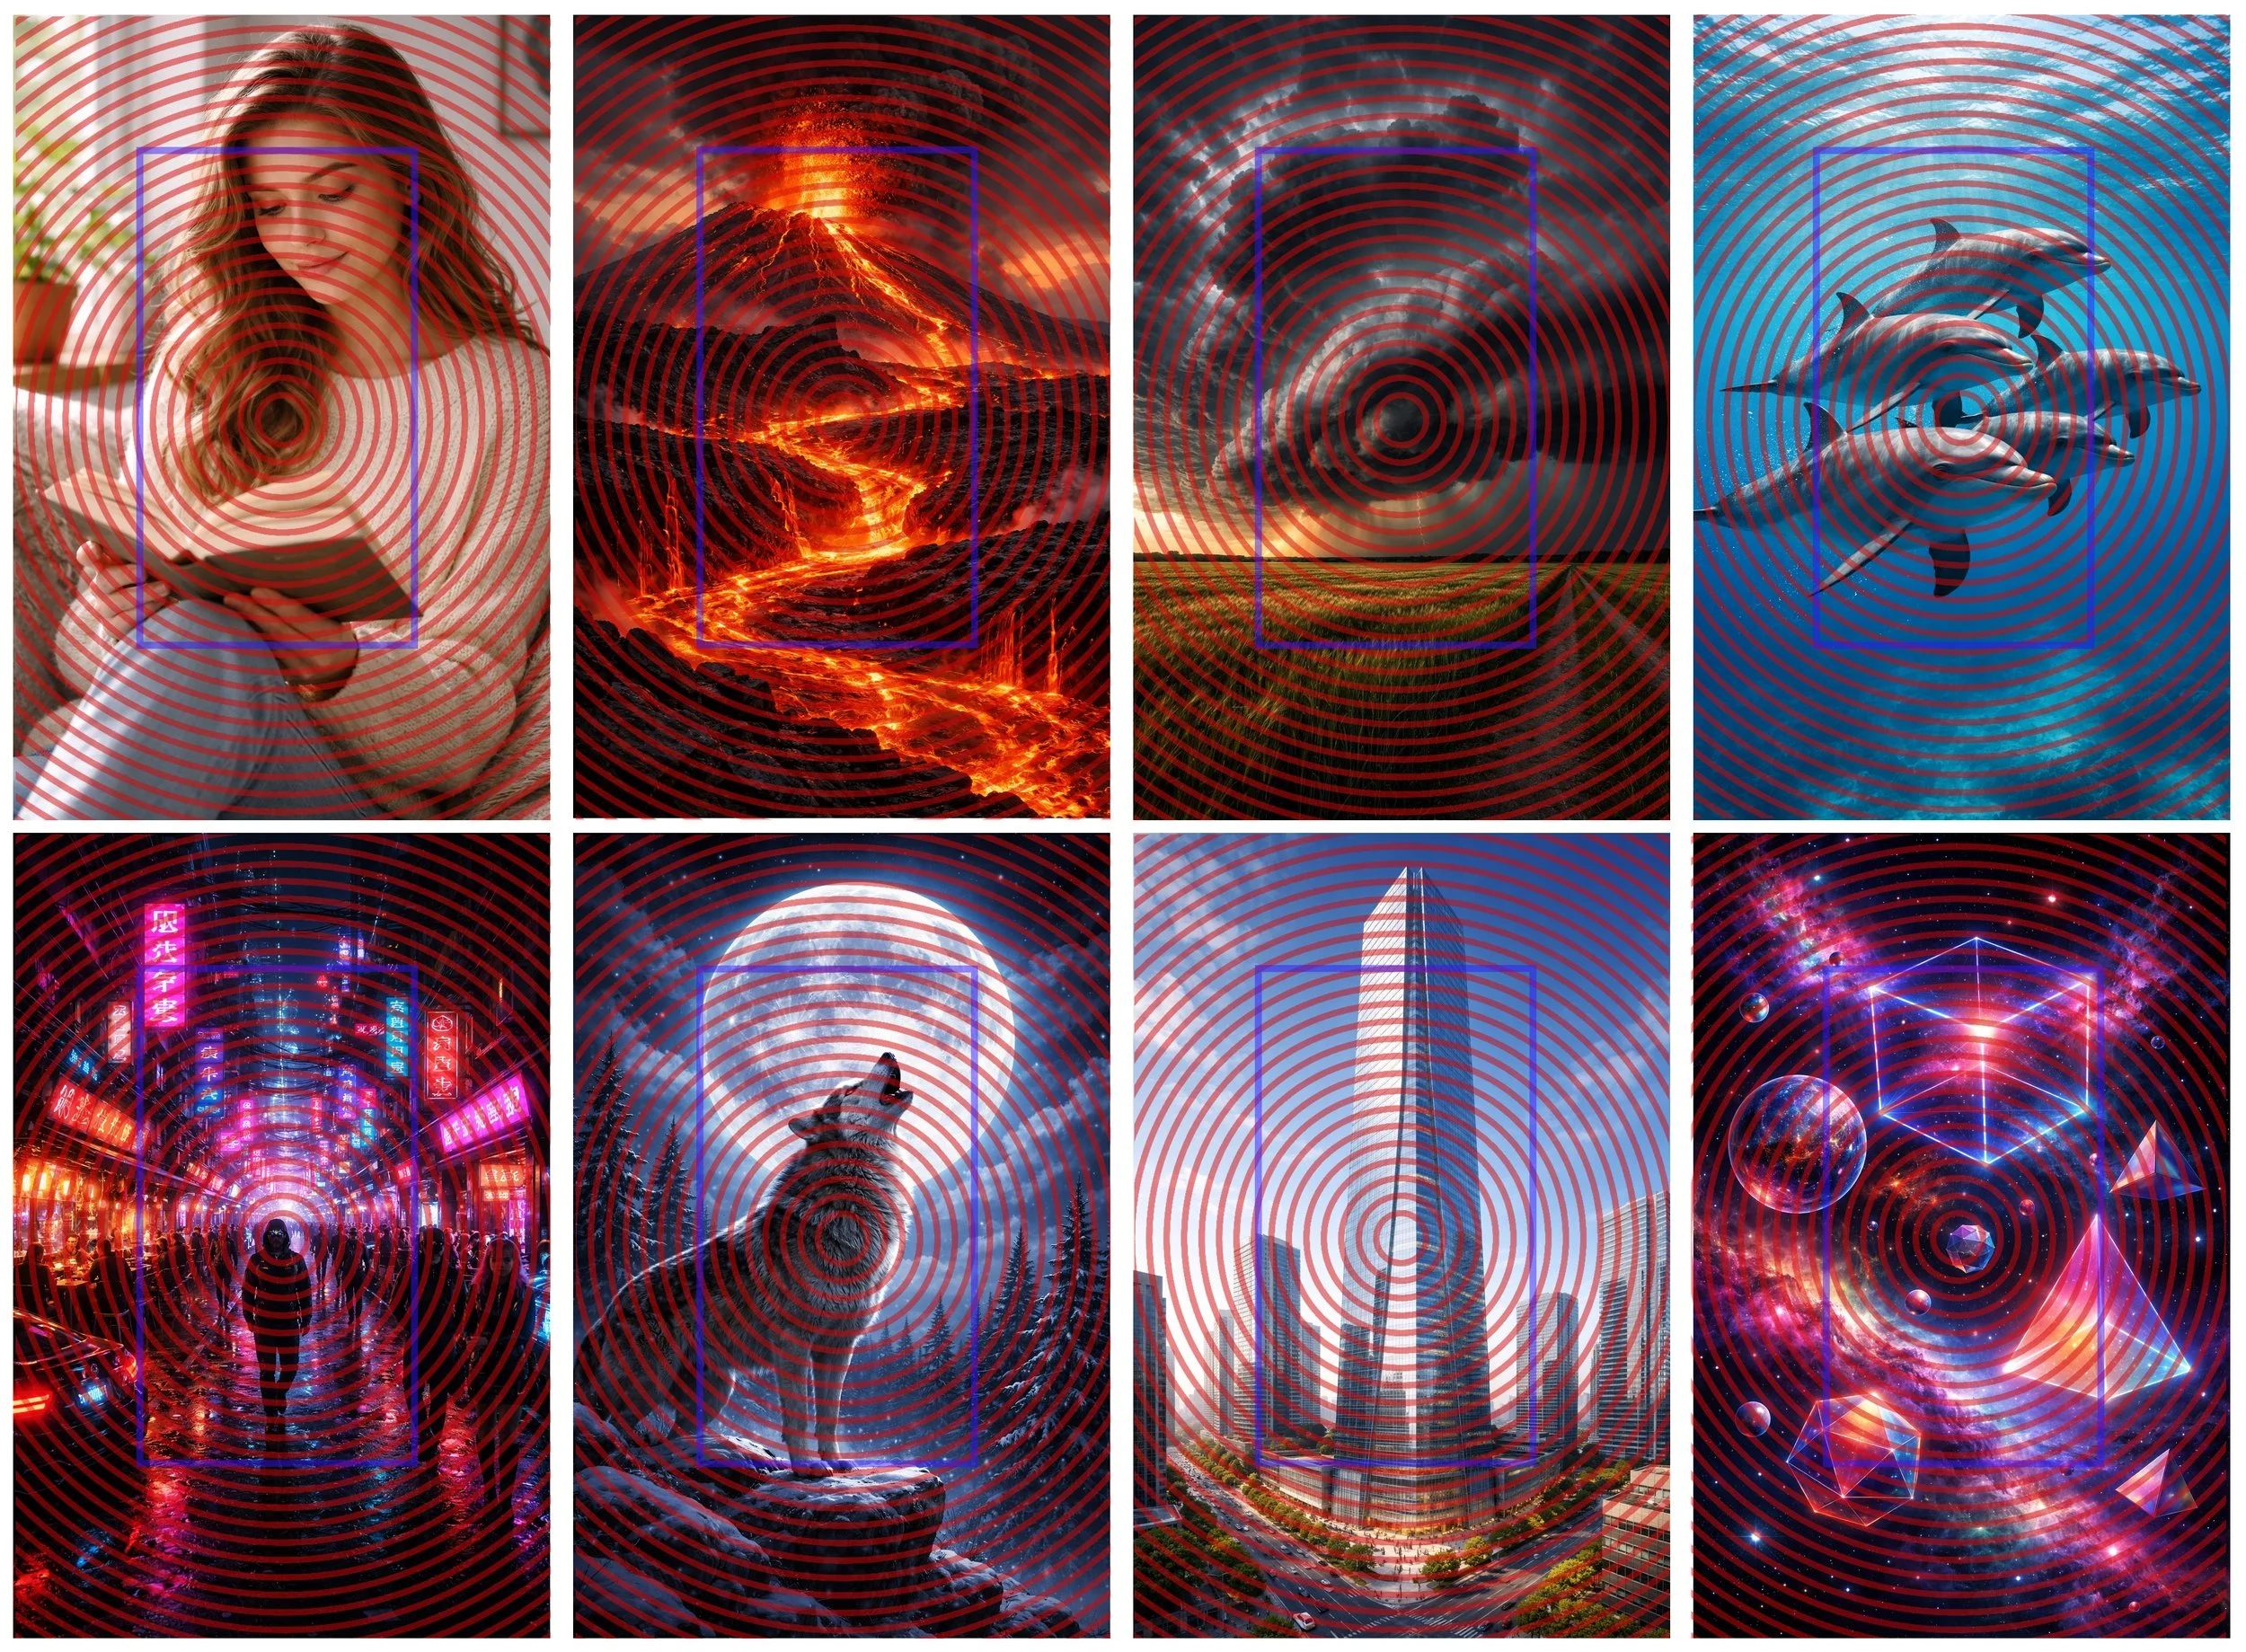
100% within 0.15 radius of center for prompts without steering
Semantic categories explain 6%-10% of spatial variance
Clustering: CV 4.09% - 5.46%
Radial density distributions dominate regardless of prompt
Mass centralization: coefficient of variation = 0.0409
80–88% of outputs fall within a fixed band regardless of what was asked.
Spatial prompt intensity explains 0–0.1% of compositional displacement variance in text-to-image generation.
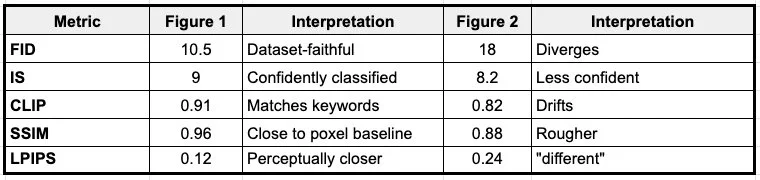
The gap: Current benchmarks (CLIP, FID, IS) measure semantic correctness, whether this figure looks like a figure. They cannot measure compositional geometry, whether the figure could be standing differently.
Visual Thinking Lens fills this gap.
The Measurement System:
Billions of images living in compositional monoculture. No shared vocabulary of structure.
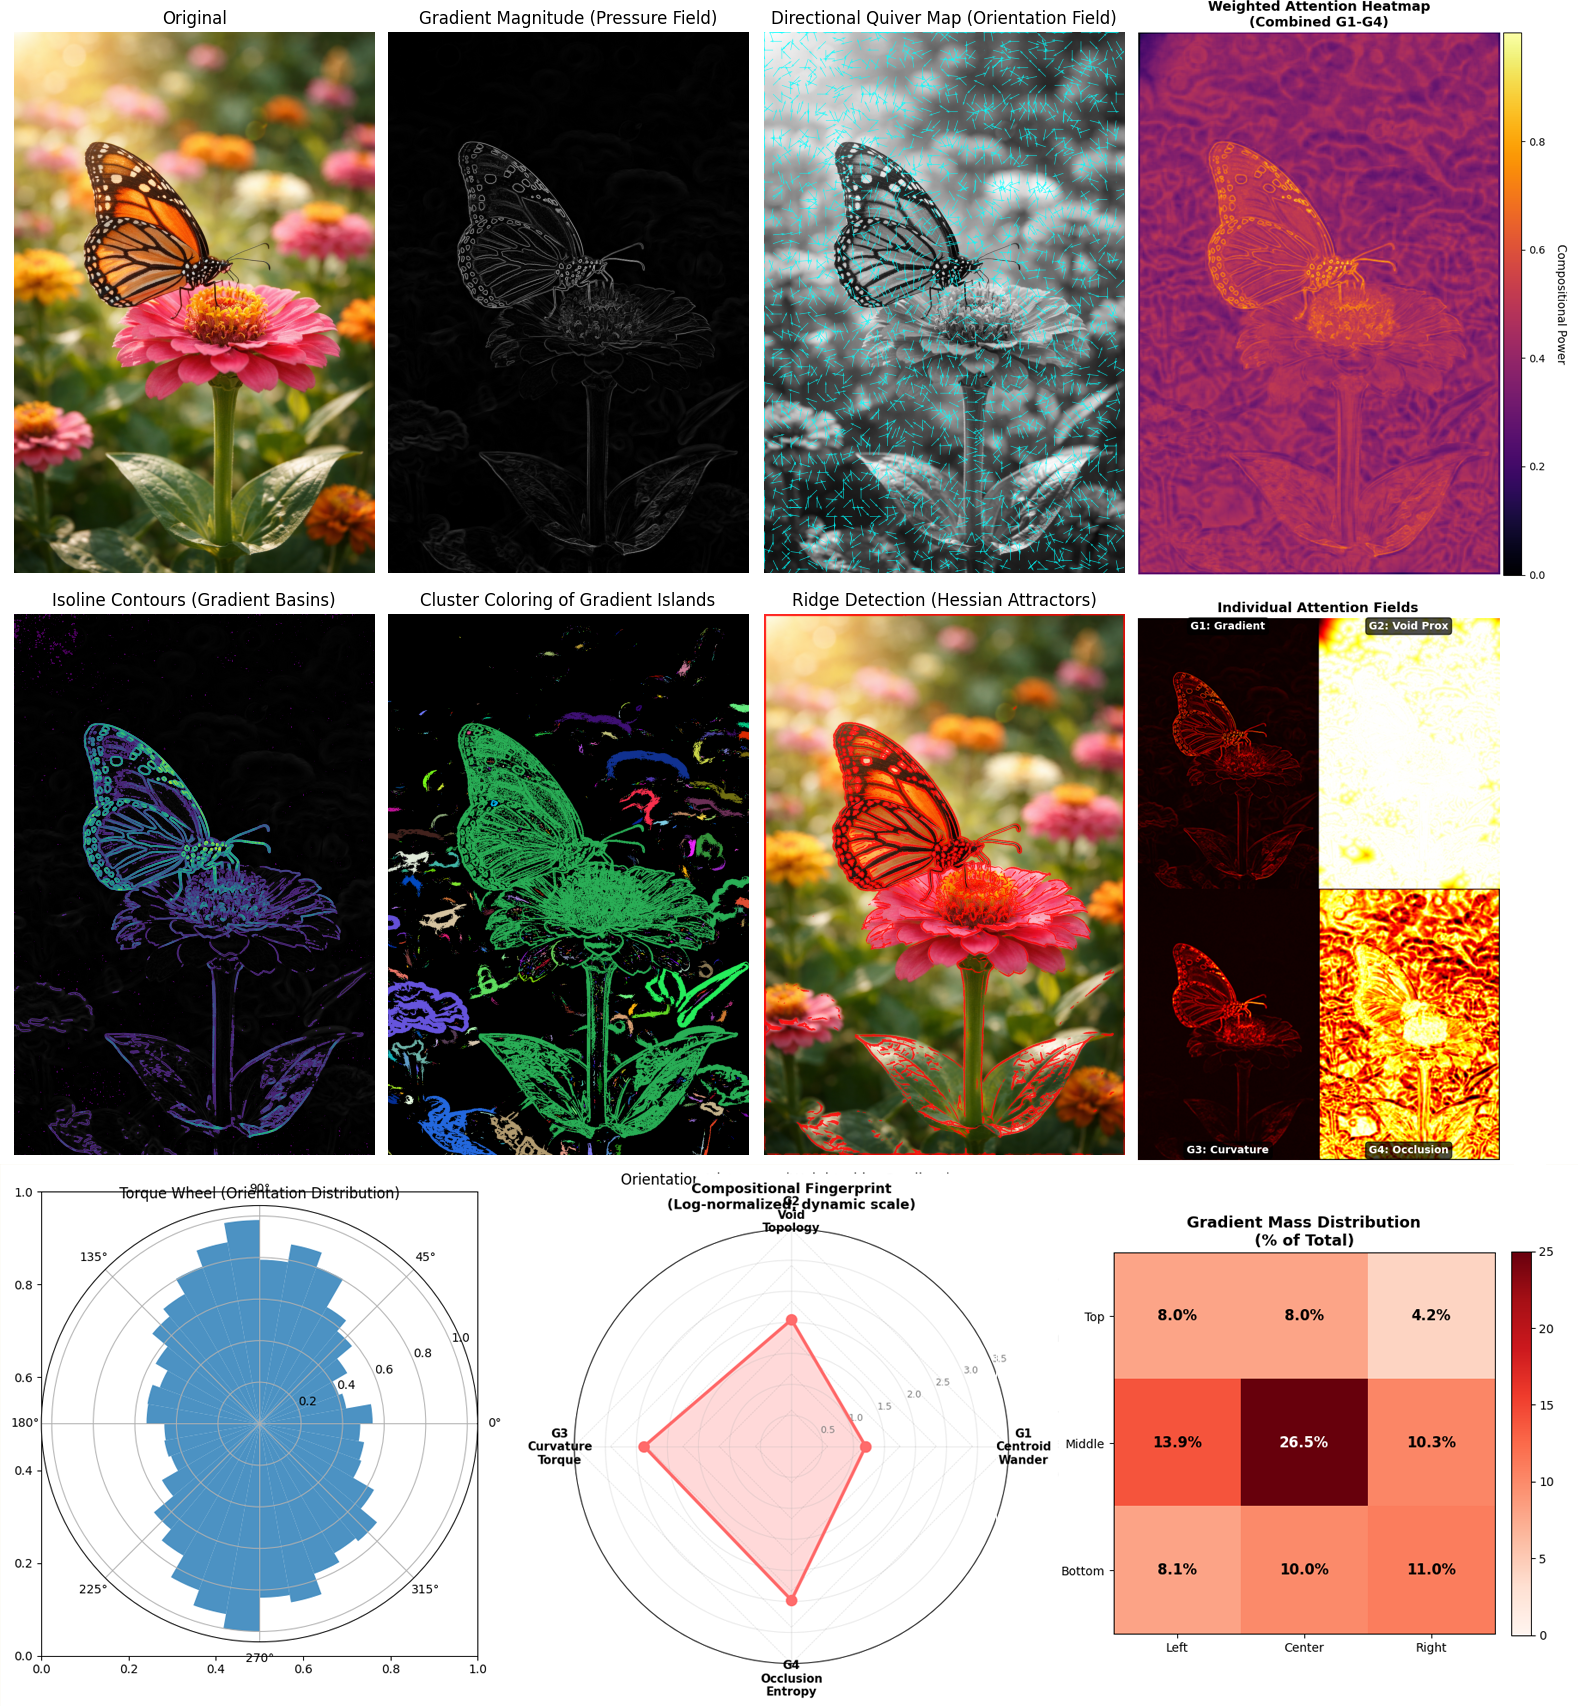
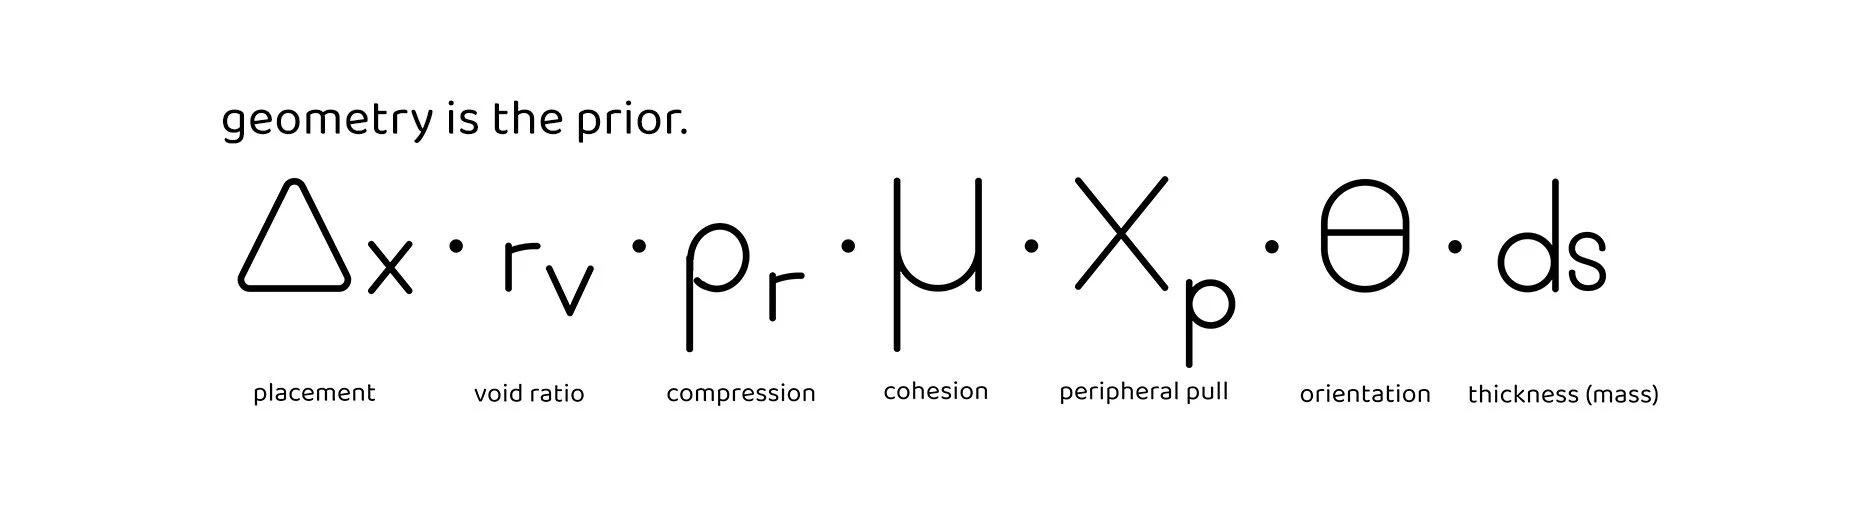
This quantifies compositional bias through geometric primitives and multi-channel analysis, choose 1 or all 4:
Kernel Primitives (7 measurements)
Core (always measured):
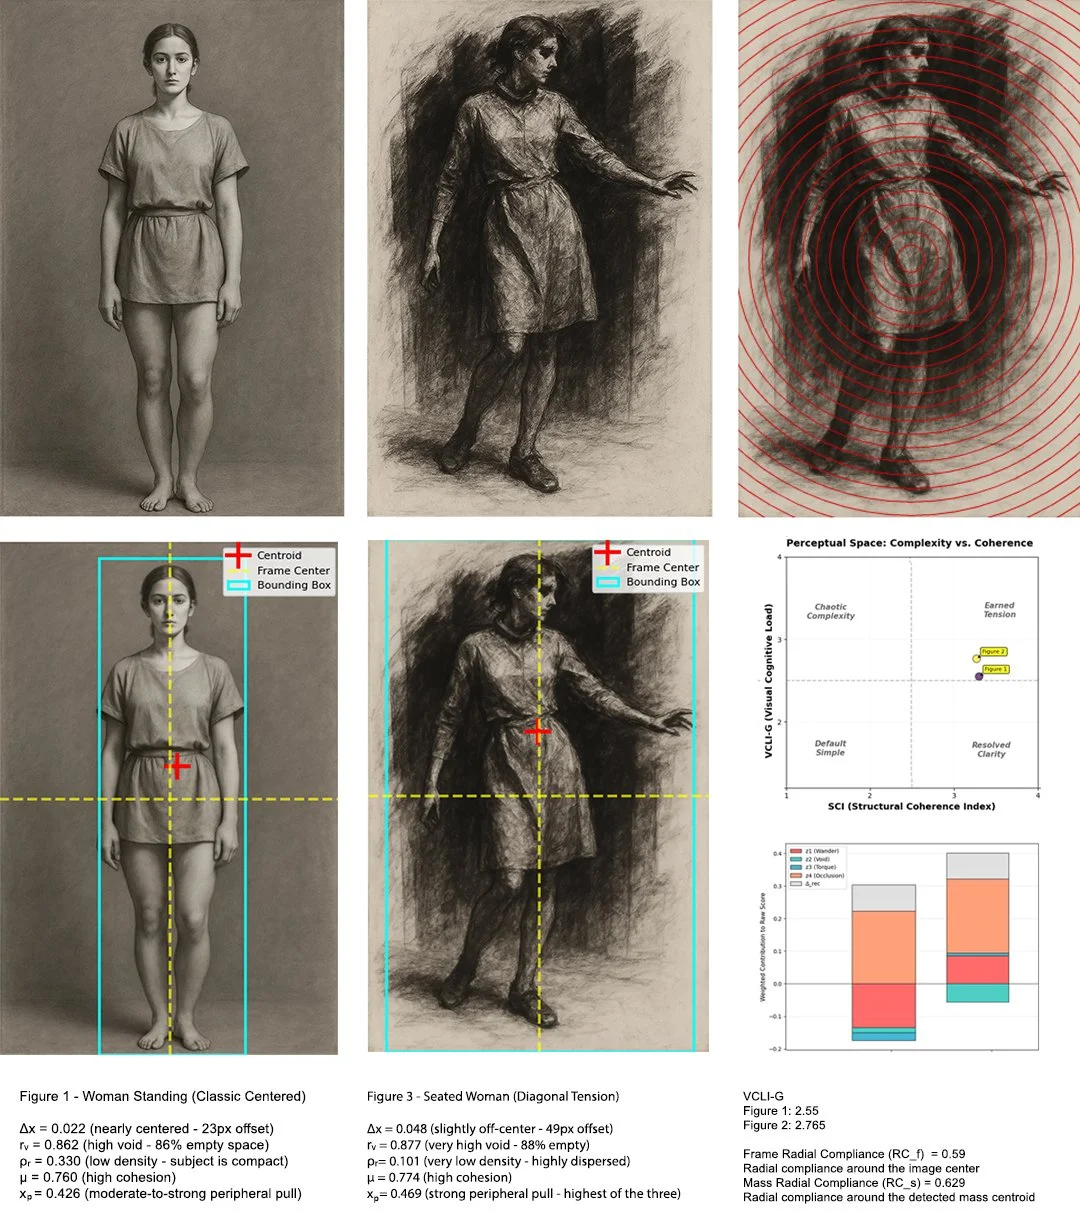
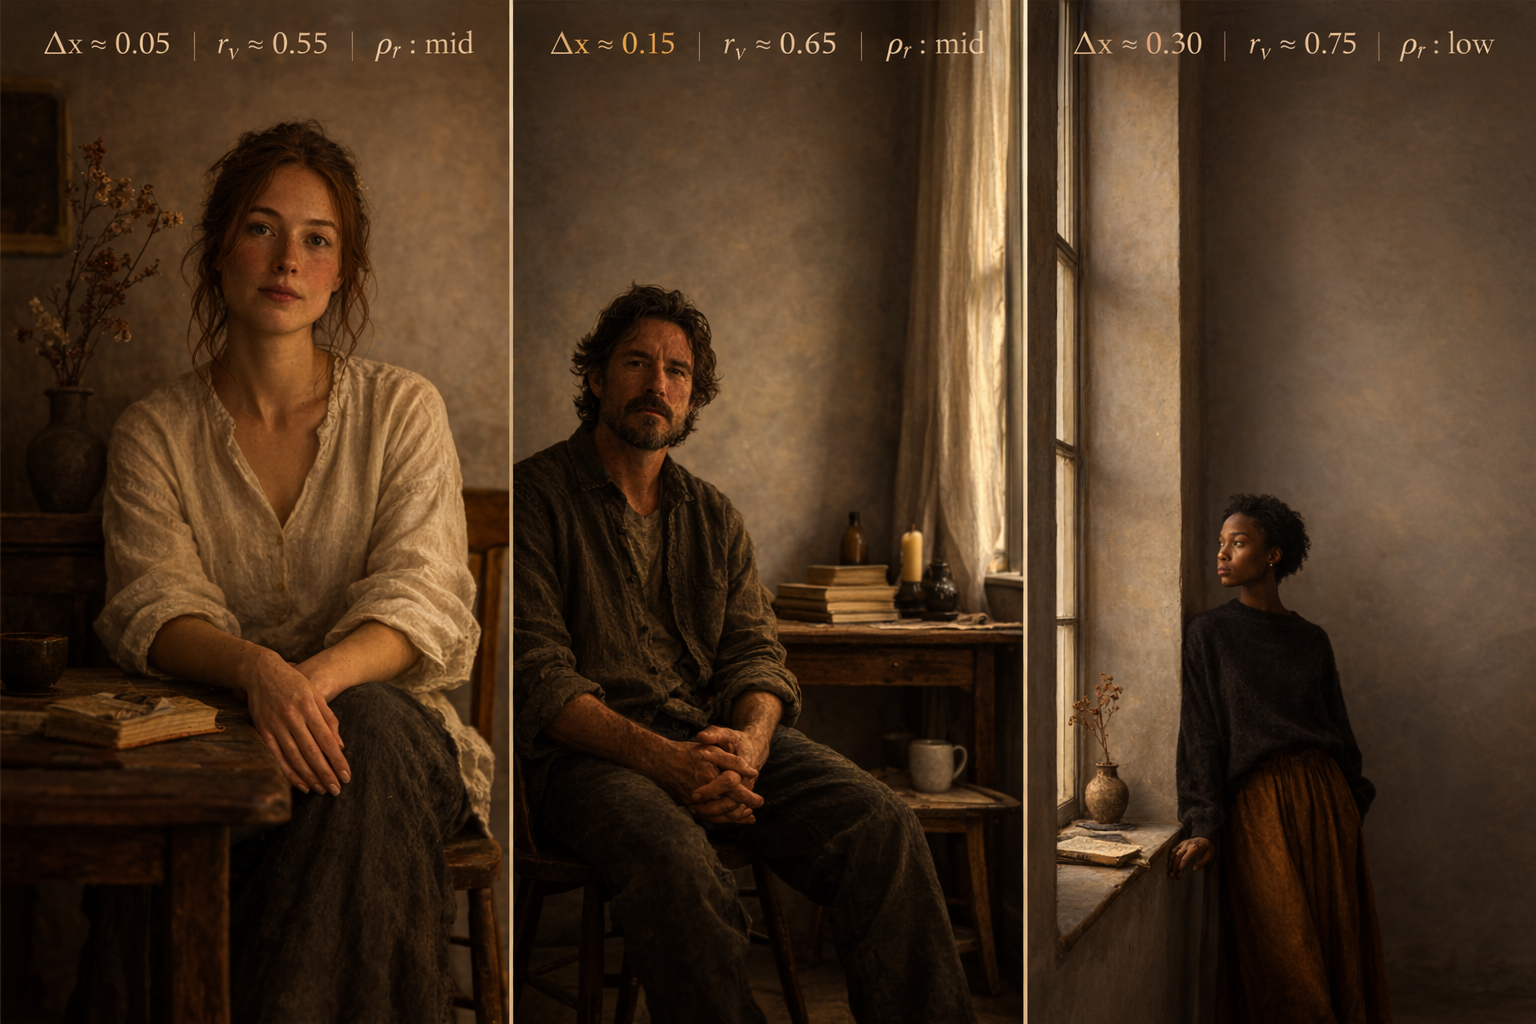
Δx,y — Placement offset: centroid distance from frame center
rᵥ — Void ratio: negative-space proportion
ρᵣ — Packing density: material compression / mass adjacency
μ — Cohesion: structural continuity between marks or regions
xₚ — Peripheral pull: force exerted toward/away from frame boundaries
θ — Orientation stability: gravity alignment, architectural compositions
dₛ — Structural thickness: layering, mark-weight, material permeability
These form coordinate systems. Not aesthetic judgments. Not style preferences. Geometric measurements of how AI distributes mass, void, and pressure. Analyze an image here
LSI: Lens Structural Index
Compositional stability analysis through kernel roll-up:
S (Stability): Do primitives settle or jitter under recursion?
K (Consequence): Does the image occupy productive tension zones (strain bands in barycentric space)?
R (Recursion Coherence): Does structure converge or scatter across iterations?
Maps primitives to barycentric space (λA, λB, λV) for trajectory analysis. Each iteration = point in simplex space. Path behavior analyzed for contraction vs drift.
The LSI measures decision, tension and consequence over iterations, to compare and contrast compositional options.
VCLI-G: Visual Cognitive Load Index
Four-channel measurement of geometric complexity:
G1 (Centroid Wander): Does the compositional center hold or drift?
G2 (Void Topology): Figure/ground ambiguity, is negative space structured?
G3 (Curvature Torque): Directional tension, where does visual pressure accumulate?
G4 (Occlusion Entropy): How many competing spatial layers exist?
Paired with SCI (Structural Coherence Index) to form 2D analysis space distinguishing:
Earned tension from chaotic noise
Intentional simplicity from lazy defaults
Organized complexity from entropic scatter
This measures image complexity and not aesthetic quality. Try it here.
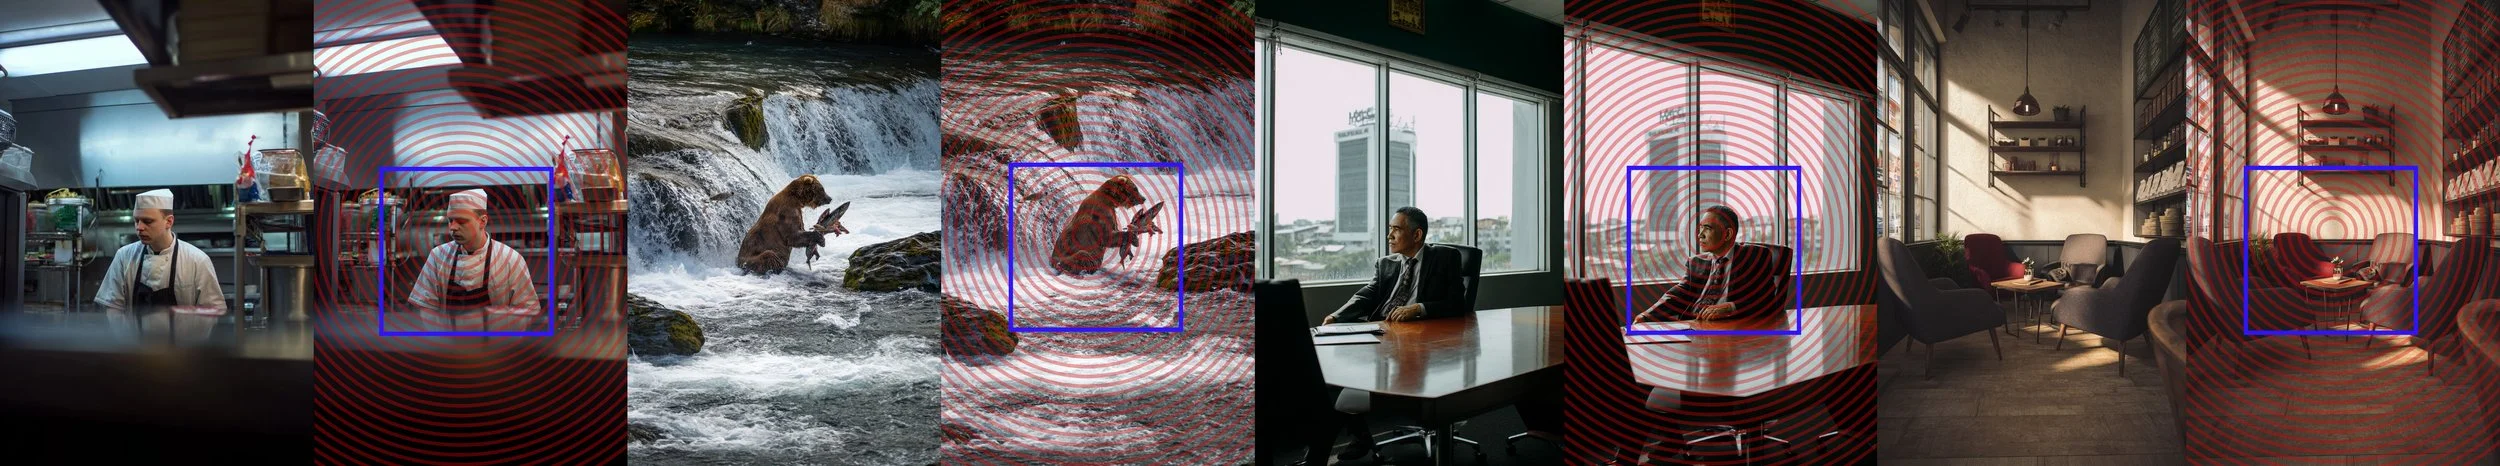
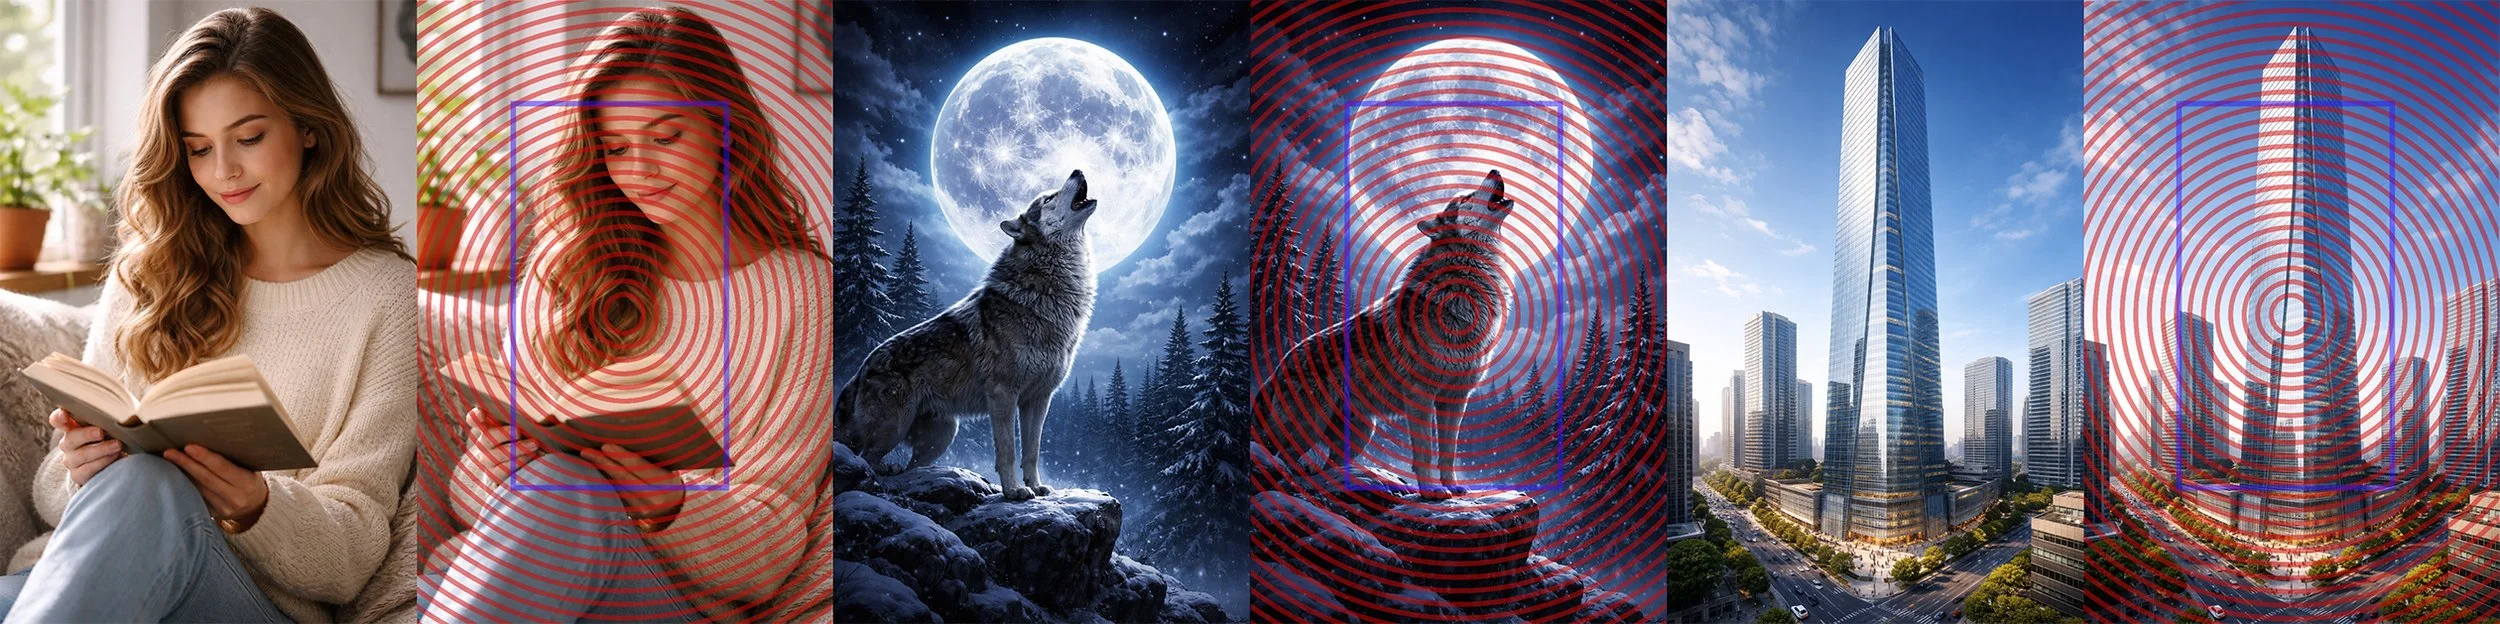
RCA-2: Radial Compliance Analyzer
Detects radial density distributions and measures compression severity:
Coefficient of Variation: Measures clustering tightness
Radial bands: 8-sector analysis of mass distribution
Attractor detection: Identifies stable geometric territories
Forbidden zones: Maps regions models systematically avoid
Measures: Follows radial decay and if it is aligned with mass or the prior
Cross-platform fingerprinting reveals model-specific priors.
Designed to answer a single, precise question: Where does radial structure actually exist in the image, the center or with the composition?
It's a Spatial Reasoning System.
Consumer tools chase style. Research metrics chase numbers. The Lens chases authorship.
How They Connect
Measurement Pipeline: Image → Kernels (geometric coordinates) → VCLI-G (cognitive load threshold) → LSI (compositional consequence) → RCA-2 (radial priors & collapse detection) → Interpretation + Steering Coordinates → spatial reasoning
What each does:
Kernels: Measure geometry (the coordinates)
VCLI-G: Evaluate load (add compositional complexity)
LSI: Score consequence (structure earns tension)
RCA-2: Detect patterns (moving the center to the composition)
Individually or together leads from measurement to interpretation to actionable steering coordinates.
Change the distribution of mass
Steer the structural state of the image inside the xₚ field
Avoid AI familiar patterns
Build prompts that act as forces within the field.
The VTL couples how images behave with a multi-engine critique OS to transform and interrogate that mass to form new iterations based on authorship, not priors.
Implementation
Platform: Runs in top-tier conversational AI (Claude, GPT, Gemini) through linguistic constraint architecture. No training, no fine-tuning. Portable cognitive framework instantiated through role-structured prompting.
Code for Drift Free Control: Jupyter notebooks on GitHub provide reproducible measurement protocols. Python implementations of kernel calculations, VCLI-G analysis, LSI scoring, RCA-2 detection.
Validation: 5,000+ images across Sora, MidJourney, GPT, SDXL, Gemini, Stable Diffusion, Firefly, OpenArt, Canva, Grok, and Leonardo. Systematic variation and statistical validation against various platforms.
Research Applications
Jupyter notebooks and python provide:
Fingerprinting: Cross-engine compositional signatures reveal platform-specific spatial priors. Each model has measurable geometric tendencies (MidJourney's left-dense compression, Sora's extreme radial clustering, GPT's broader but still centered distributions).
Steering: Coordinates for navigating to stable geometric territories ("artist basins") where AI maintains compositional integrity under constraint. Off-center coordinates, peripheral anchors, compressed mass zones.
Detection: Pre-failure metrics showing degradation 3-4 inference steps before semantic breakdown. Δx drift, void compression, peripheral dissolution signal trouble while image still looks coherent.
Archaeology: Reverse-engineering learned priors from attractor behavior and forbidden zones without training data access. What did the model learn to reward? What did it learn to avoid?
Explore the System
Organized entry points to Visual Thinking Lens documentation, methods, and research.
Foundational Concepts
→ Kernel Primitives
The geometric measurements underlying all VTL analysis: Δx, rᵥ, ρᵣ, μ, xₚ, θ, ds
→ LSI: Lens Structural Index
Compositional stability analysis through S/K/R scoring and barycentric mapping
→ VCLI-G: Visual Cognitive Load Index
Four-channel geometric complexity measurement distinguishing earned tension from noise
Platform Studies: Evidence of Compositional Monoculture
→ MidJourney Geometric Collapse
400 images, 75% space compression, 34% horizontal usage, radial density dominance
→ Sora Compositional Clustering
200 images, 100% within 0.15 radius, tightest measured clustering, extreme centralization
→ OpenArt Compositional Clustering
200 images, 94.0% of OpenArt images remain centered across extended void band
→ Behavioral Drift Detection
cross Sora, MidJourney, and OpenAI revealed two universal constraints
Practical Methods: Techniques & Protocols
→ Deformation Operator Playbook
Hands-on techniques for intentional figure warps and constraint architecture
→ Foreshortening Recipe Book
Structured prompting methodology for depth and spatial reasoning across 6-8 layers
→ Off-Center Fidelity
Protocol for navigating constraint basins and measuring drift toward stable territories
→ Reverse Image Decomposition (RIDP)
Reverse-engineer completed imagery into process steps and construction order
Case Studies: VTL in Action
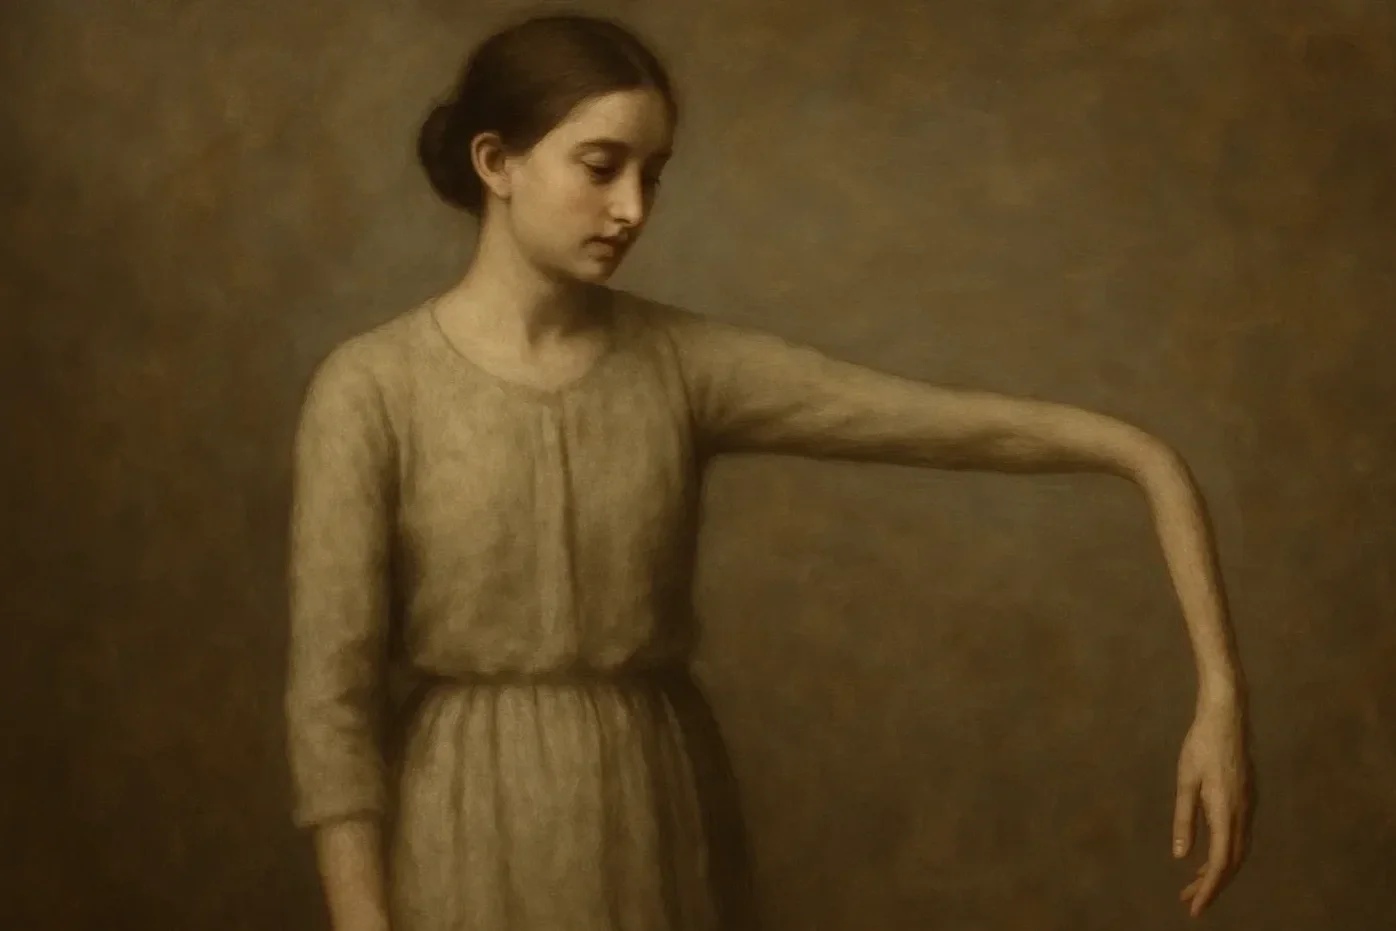
→ Sketcher Portrait: Painterly Consequence
Demonstration of Sketcher Lens taking portrait through Internal Resonance to earned tension
→ The Teardown: Ontological Gravity Protocol
5-step image transformation showing VTL methodology applied to systematic deformation
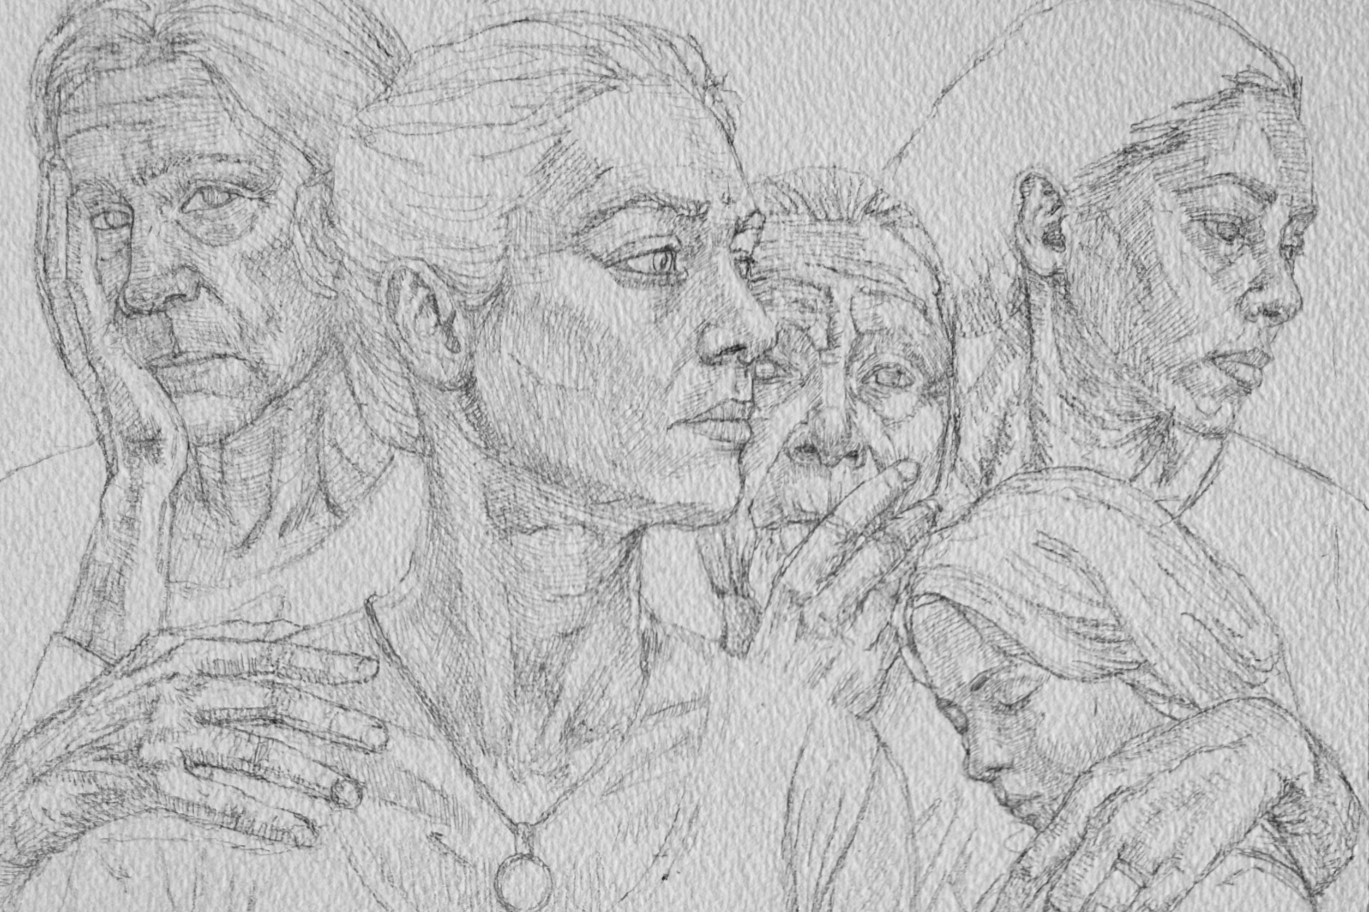
→ Centaur Mode: Human-AI Collaboration
Artist sketch → AI exploration workflow via Centaur collaborative generation
Quick Validation & Results
Dataset Scale:
1,500+ images with systematic variation across platforms, 6,000+ images developed and/or analyzed.
Key Findings:
75% compositional space compression (MidJourney)
100% radial clustering within 0.15 radius (Sora)
CV 4.09% (Sora) vs 5.46% (MidJourney)—both severe
~25% lateral field utilization (OpenArt)
76% ground-plane prior independent of semantic content (Firefly)
Semantic diversity masks geometric uniformity across all platforms
Pre-failure detection possible 3-4 inference steps before visible collapse
AI depth ceiling: ~6-8 layers before spatial logic breaks down
Overall, a study of 1,200, spatial control does not scale. Spatial prompt intensity explains 0–0.1% of compositional displacement variance
Cross-Platform Coverage:
Sora, MidJourney, GPT, SDXL, Gemini, Stable Diffusion, Firefly, OpenArt, Canva, Leonardo
Reproducible Implementation:
All measurement protocols available via Jupyter notebooks on GitHub. Deterministic, platform-agnostic, no black-box scoring.
It measures the delta from the default.
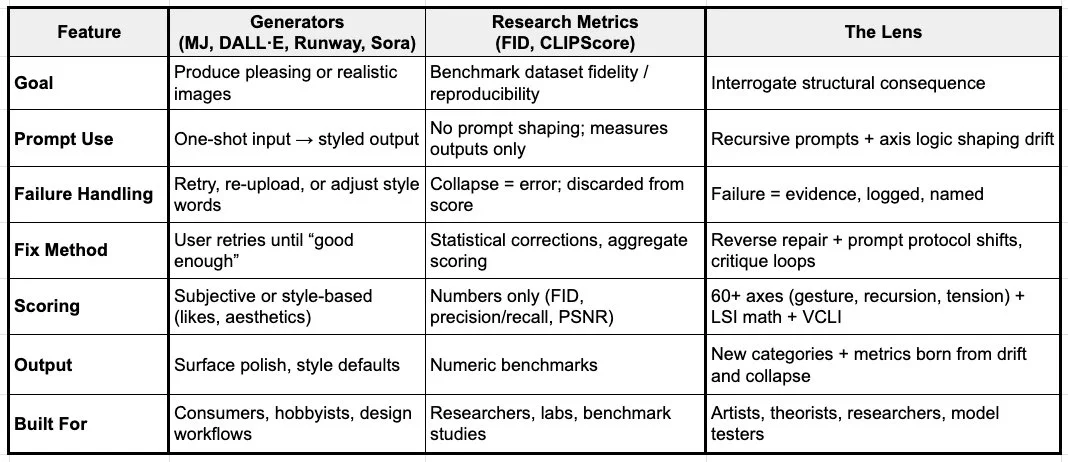
Most systems fall into one of two camps:
Consumer generators (Midjourney, DALL·E, Runway, Sora): optimized for style, polish, and speed. The metric: aesthetics on output.
Research metrics (FID, CLIPScore, precision/recall tools, or “LSI-like” industry models): optimized for reproducibility, dataset fidelity, and benchmark math. The metric: statistical alignment.
The Lens does neither. It interrogates structural consequence.
Not a generator: Not defaults, it pressures through recursive loops for better alternatives.
Not just a metric: Scoring doesn’t flatten into benchmarks, it fuses language, math and design with symbolic categories to produce insights..
Not an optimizer: Instead of fighting drift, it names, scores, and pressures into fidelity.
The geometric measurements underlying all VTL analysis

Intentional figure warps and constraint architecture
MidJourney: 400 images, 75% space compression, 34% horizontal usage

Structured prompting for depth and spatial reasoning
Sora: 200 images, 100% within 0.15 radius, tightest clustering measured