Does the image hold?
The Lens Structural Index (LSI) doesn’t ask if an image looks like the dataset. It asks if it has structural pressure.

The LSI measures not resemblance but resilience under pressure. It asks whether an image has structure and if it can survive structural drift, recursion collapse and rebuilding, not just if it looks good once. Built of geometry and code, it is the Len’s drift free compositional scorer.
The Problem
Traditional metrics like FID, CLIP, and SSIM measure fidelity to data, pixels, or prompts. They tell you whether an image looks close enough to its source, but never whether it holds together as a composition. LSI closes that blind spot by treating images as systems under strain.
What LSI Measures
LSI analyzes an image through a number of geometric primitives such as: Δx (centroid drift), rᵥ (void ratio), ρᵣ (packing density), μ (cohesion), xₚ (peripheral pull), θ (orientation stability) and ds (structural thickness). These primitives can combine into structural scores such as stability, consequence, or recursion, which roll into a single LSI100 composite. It’s not about polish; it’s about whether the form survives stress.
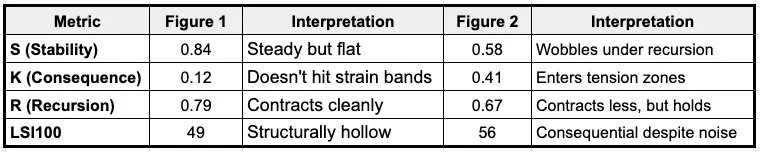
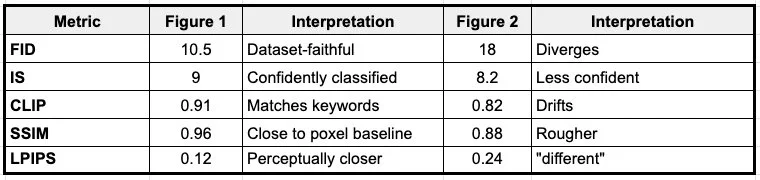
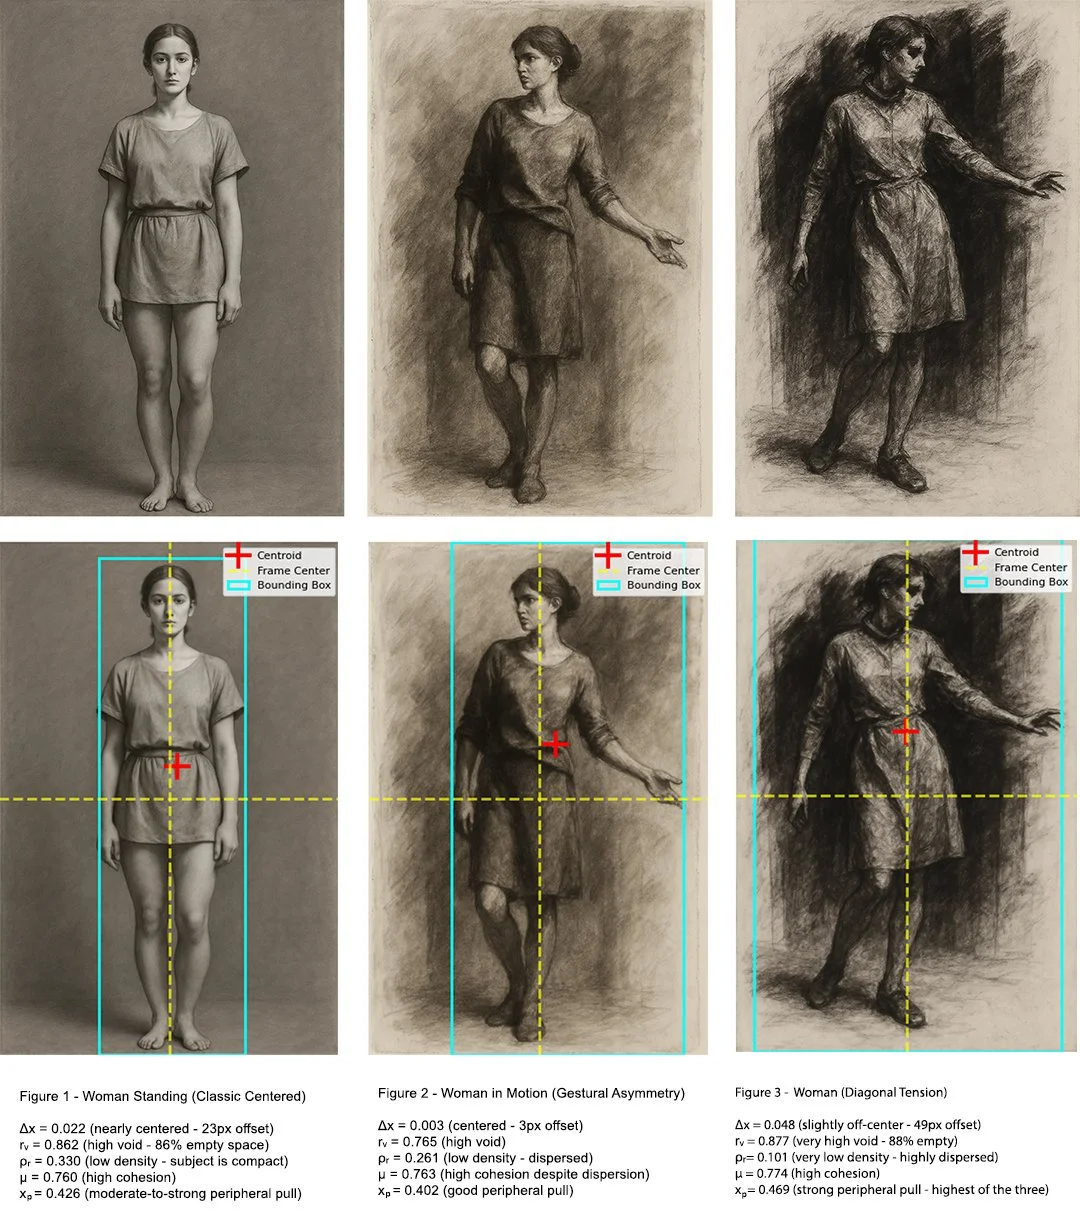
Using the two figure set above, the Standard ML Metrics signal dataset fidelity, prompt alignment, and pixel-level similarity. Figure 1 reads “better” by ML metrics (closer to data, smoother, safer), the second a little lesser so. Both figures “look right” to these metrics, with only minor differences between the frontal and angled drawings. From an ML standpoint, both are high-quality, prompt-matching images.
To contrast, LSI Metrics reveals the structural trade-off.
The first figure scores higher in stability (S=0.85) and recursion (R=0.78), meaning its form locks in securely. But its consequence is low (K=0.10), showing it doesn’t engage strain bands, the composition is steady but inert.
The angled study sacrifices some stability (S=0.55) but gains in consequence (K=0.42), as voids, tilt, and rupture create stronger strain engagement. Its composite (LSI100=0.56) edges higher because it carries structural consequence even if it jitters more.
This comparison illustrates why Lens Structural Index (LSI) is complementary to standard ML metrics rather than contradictory. Taken together, ML metrics say both images are good replicas of data and prompts, while LSI adds: one is safe but static, the other unstable but more structurally alive.
Key takeaway: ML metrics ask: Does it look like the data? LSI asks: Does it hold as form under pressure?

Consequence
For researchers: LSI reveals why models with identical FID diverge in long runs.
For artists/designers: It offers real-time feedback on why an image feels unstable or hollow.
For QA/testing: It detects collapse states that other metrics smooth over. In every case, LSI makes drift and failure visible as data, not noise.

Interpretive Bands
LSI produces a 0–100 score. Below 40 collapse; 40–60 drift or instability; 60–80 strong performance; and 80+ signals rare resonance. These bands help distinguish between surface-stable images and those that carry lasting compositional vocabulary. Simplified example:
Portrait 1 LSI 46.8: Frontally centered, soft light; not enough edge/mark commitment, reads subdued. This is a very standard AI ideal portrait.
Portrait 2 LSI 54.6: More breathing room; overall offset makes for more visual interest.
Portrait 3 LSI 75.9: Decisive off-center with steady background, frame gains presence and holds.
Composite : initial limiter ρᵣ (energy deficit) gave way to Δx (placement) as the principal constraint; after Δx improved, ρᵣ again becomes the farthest-from-center primitive.
Healthy rᵥ window: rᵥ moved from under-filled (#0) to comfortably in-band (#1–#2), supporting the eventual pass.

Recursive Mode: Additional Metrics
Stability (S): variance suppression across iterations
Consequence (K): closeness to strain bands (Δx, rᵥ, ρᵣ)
Recursion (R): basin contraction and repeatability of λ-path
Stability (S): What it looks for: Variance of primitives across iterations.
Consequence (K_raw): What it looks for: Unnormalized joint fit of Δx, rᵥ, ρᵣ, μ, xₚ to target tension bands (did each axis contribute?).
Consequence (K) (used for scoring/plots): What it looks for: Fit to target tension bands, using the geometric mean of per-axis fits.
Example Case Study Mountains: Top-Level Numbers (Priority Readout)
Stability (S = 0.61): Primitives hold together, but axis drift and depth loss undermine resilience.
Consequence (K = 0.43): Just under strain-band; movement is significant but not structurally decisive.
Recursion (R = 0.81): High coherence, progression is sequential, not chaotic; system reads as “draining” rather than oscillating.
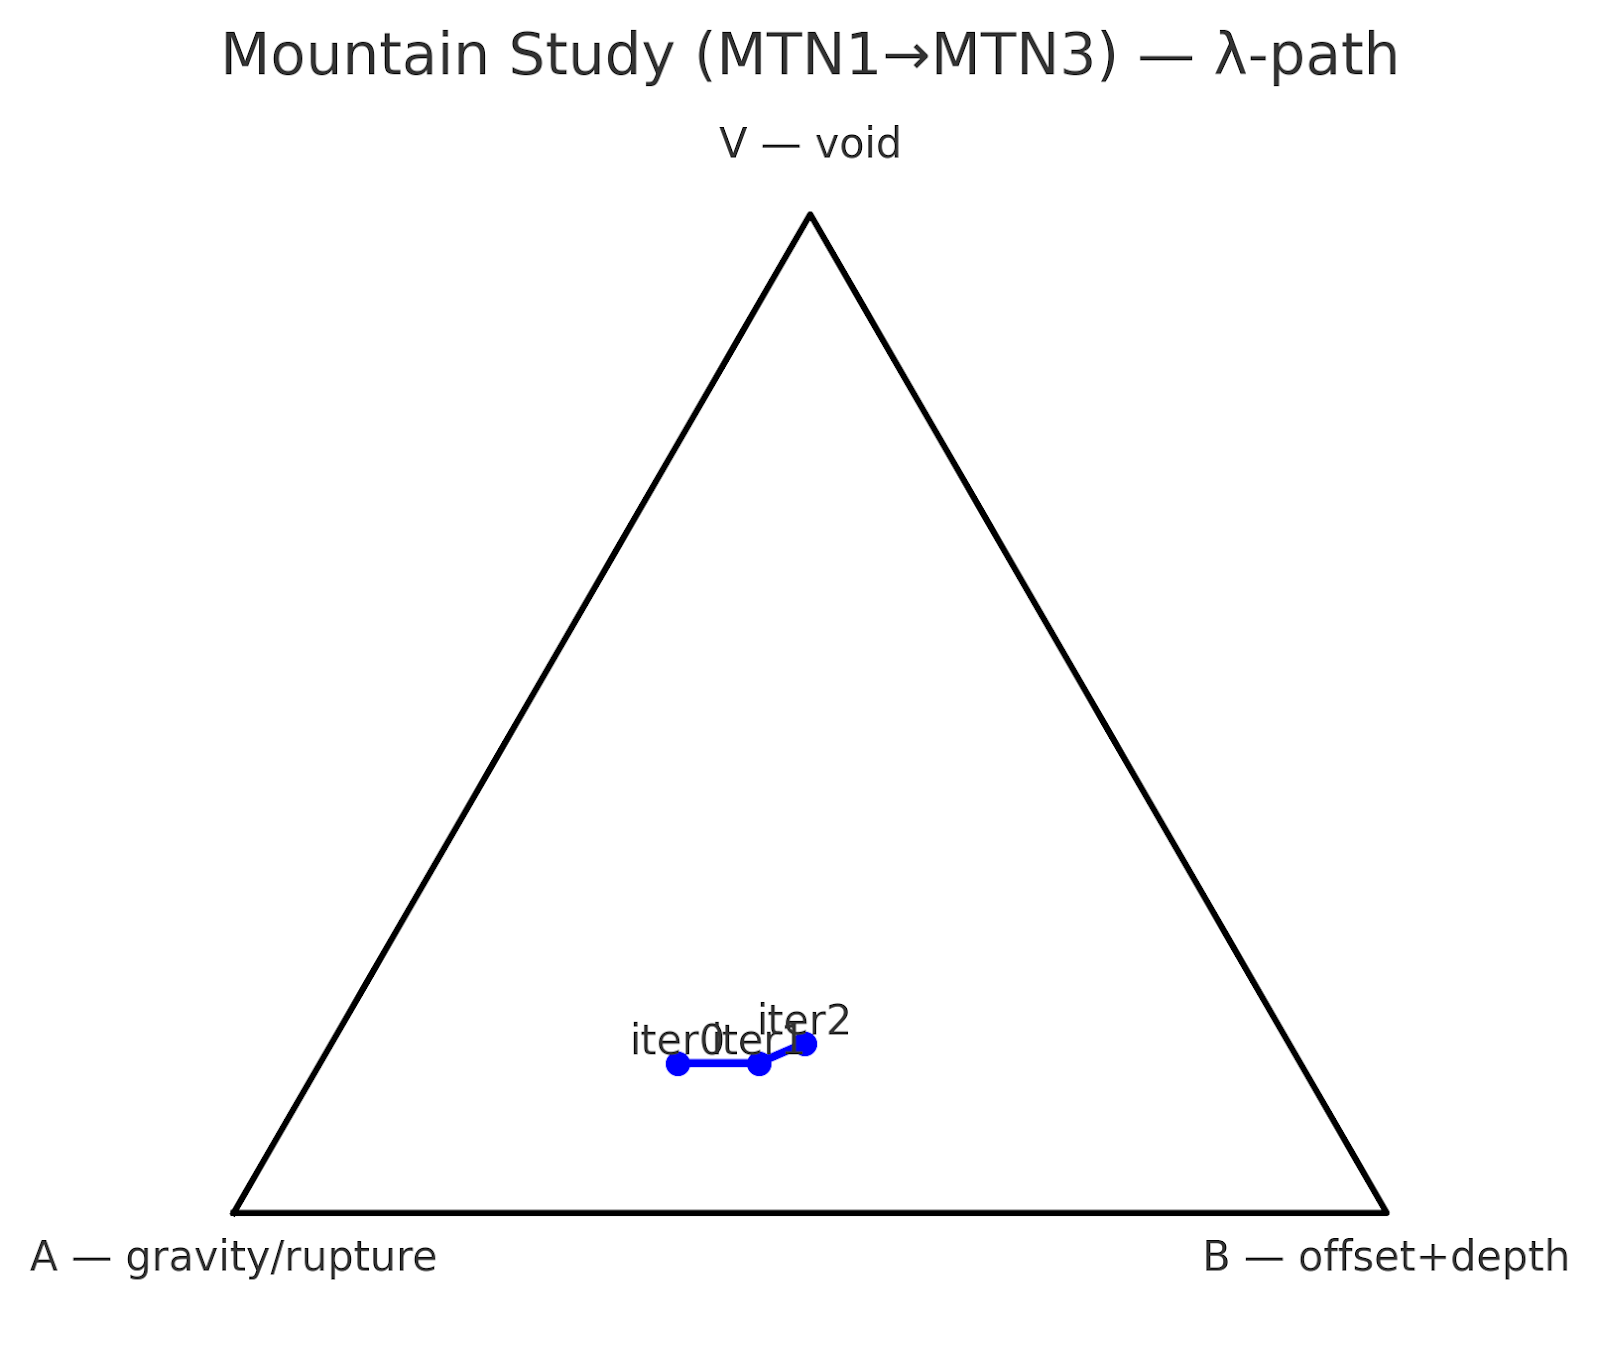
Barycentric map: All of this brings together:
The barycentric mapping to (λA, λB, λV) coordinates - while it doesn’t affect acceptance, it gives a way to plot any image as a point in structural space, and presumably track how iterations move through that space and navigate torque/rupture (A), mass/depth (B), void (V); track iteration as a λ-path. Diagnostic only; complements S/K/R.
The Δx is crucial - it is measuring structural degradation that correlates with off-center weighting, not penalizing asymmetry as an aesthetic choice. So an intentional asymmetrical composition would register differently than accidental drift toward collapse, even if both have similar centroid offsets.
So: λA, λB, λV are just barycentric weights of the primitives, placing each iteration as a point in the triangle.
A corner = structure dominated by central gravity + rupture.
B corner = dominated by offset and thick mass.
V corner = dominated by void.
So, MTN0 → iMTN1: Drift A → B: gravity/rupture weight eases (0.54→0.47) while offset+depth (B) rises (0.31→0.38). Void stays flat (0.15). Read: the image shifts from monumental anchoring toward shoreline/foreground organization without increasing emptiness yet.
iter1 → iter2: Continued pivot toward B, with a small rise in V (0.15→0.17). Read: offset control strengthens but skeletal depth thins; void begins to participate via the lake field.

Differentiator
Other metrics measure fidelity to data. LSI measures fidelity to form. It doesn’t optimize for resemblance, it tests whether composition, voids, and rupture patterns withstand recursive pressure. That’s why it exposes differences other benchmarks can’t see.
It is a diagnostic tool, not aesthetic judgment. LSI quantifies what art directors intuitively understand, such as: dynamic balance, breathing space, structural breaks, and compositional gravity. Other metrics can't articulate these principles mathematically.
In Summary: Creative Reality vs. Academic Theory
Artists work with generative tools as sculptural material: iterating, testing, refining. Any evaluation metric that ignores this iterative reality measures something other than what many creators actually produce. The academic "single analysis" model fundamentally misunderstands creative practice.
How Artists Actually Work: Professional creative workflows rarely involve single-generation outputs
Iterative Refinement: Multiple generation cycles to achieve compositional control
Layer Compositing: Multiple outputs combined for final compositions
Progressive Development: Building complexity through recursive enhancement
Structural Testing: Pushing compositions to identify breaking points
The Hidden Collapse Problem
Single-frame metrics miss a critical failure mode: images that look structurally sound but collapse under iteration.
Research Perspective: Metrics like FID, CLIP, and SSIM treat images as endpoints, statistical samples compared against training distributions. They ask: “Does this look like what we expect?”
Structural Perspective (LSI): Iterative evaluation asks: “Does this image survive pressure?”
Key Difference
Structural: Similarity metrics reward images that match distribution but ignore compositional voids or strain failures.
Momentary Coherence: Single-frame evaluation rewards surface appearance, not structural survivability.
Statistical Bias: Similarity metrics regress toward the training set mean, obscuring collapse modes that only appear under iteration.
User Perspective: Creative Reality vs. Academic Theory
Academic Tools (FID/CLIP/SSIM): Designed for statistical benchmarks; fail to detect when images collapse under manipulation or recursion.
Structural Lens (LSI): Built for creative and generative contexts; prioritizes survivability, consequence, and pressure-resistance.
LSI shifts the question from “Does this match the dataset?” to “Does this hold under strain?” Academic research prioritizes computational efficiency because researchers evaluate thousands of images across datasets. This optimization serves statistical analysis, not creative assessment.
Artists work differently:
Quality over Quantity: Better evaluation of fewer images beats superficial assessment of many
Process Integration: Recursive analysis aligns with existing iterative workflows
Structural Understanding: Deeper insight into compositional dynamics justifies additional computation
These failures are invisible to FID/CLIP analysis but immediately apparent to practicing artists who work iteratively with the material. It is also found that an engine can begin to collapse an image, only in the next iteration to find stabilization zones. Simply limiting to “success” in imagery - misses the iterative and learning process of artists. The LSI maps these iterations, giving new tools for both researchers and artists to see evolution of not only latent space, but gravity and drift, formulating new and unique paths of exploration.
The recursive framework acknowledges how images actually function in creative practice as well as steering through latent space: both are structural materials that must survive iterative development, not as statistical success or collapse objects to be catalogued or just pulled to the center. The computational cost objection assumes evaluation metrics should optimize for research convenience rather than creative utility. If validated, LSI could provide the start to a quantitative framework for compositional integrity - something the creative industries understand intuitively but cannot currently measure systematically. It doesn't replace existing metrics; it measures an orthogonal dimension of image quality that current approaches miss entirely.
Competitive Value
LSI reframes evaluation around “holding as an image” which is something art directors, designers, and visual professionals intuitively understand, but which ML metrics consistently miss.
Primitives (the delta): Does the composition exhibit a silent, dynamic or default balance?
Coherence Under Pressure (iteration): Will the form maintain structural integrity across iterations?
Trajectory Mapping (barycentric drift): How does the structure evolve, not just where it lands?
Temporal Dimension
Traditional metrics are single-frame snapshots. LSI introduces trajectory analysis - how does structure evolve across iterations? This reveals whether an image has genuine structural integrity or just momentary coherence.
Compositional Grammar
LSI quantifies what art directors intuitively understand: dynamic balance (Δx), breathing space (rv), structural breaks (ρr), and compositional gravity. Other metrics can't articulate these principles mathematically.
Basin Analysis
LSI's concept of compositional "basins" - stable zones where structure converges - has no equivalent in ML metrics. This predicts which compositions will remain coherent versus which will collapse under iteration.
From Correlation to Causation
Traditional metrics measure correlation with training data or human perception. LSI measures structural causation - what makes an image compositionally robust? This shift from resemblance to resilience represents a fundamental advance in how we evaluate visual content.
LSI could transform how we evaluate visual content across industries - from real-time generative AI quality control to medical imaging analysis. The idea of treating images as "dynamical systems" rather than static objects creates entirely new possibilities for automated design tools, deepfake detection, and even manufacturing quality control.
The most intriguing aspect is how LSI could extend beyond images entirely. The principles of "structural stability under pressure" could apply to video, 3D models, audio, or even text. This suggests LSI might be the foundation for a new class of of “compositional diagnostics” and "structural intelligence" metrics across all media types.
From default to critique to score to rebuild to consequence

LSI bridges the gap between perceptual quality and structural consequence, enabling evaluations of whether an image is merely “accurate,” or if it truly holds as form.