Visual Topology
of Light
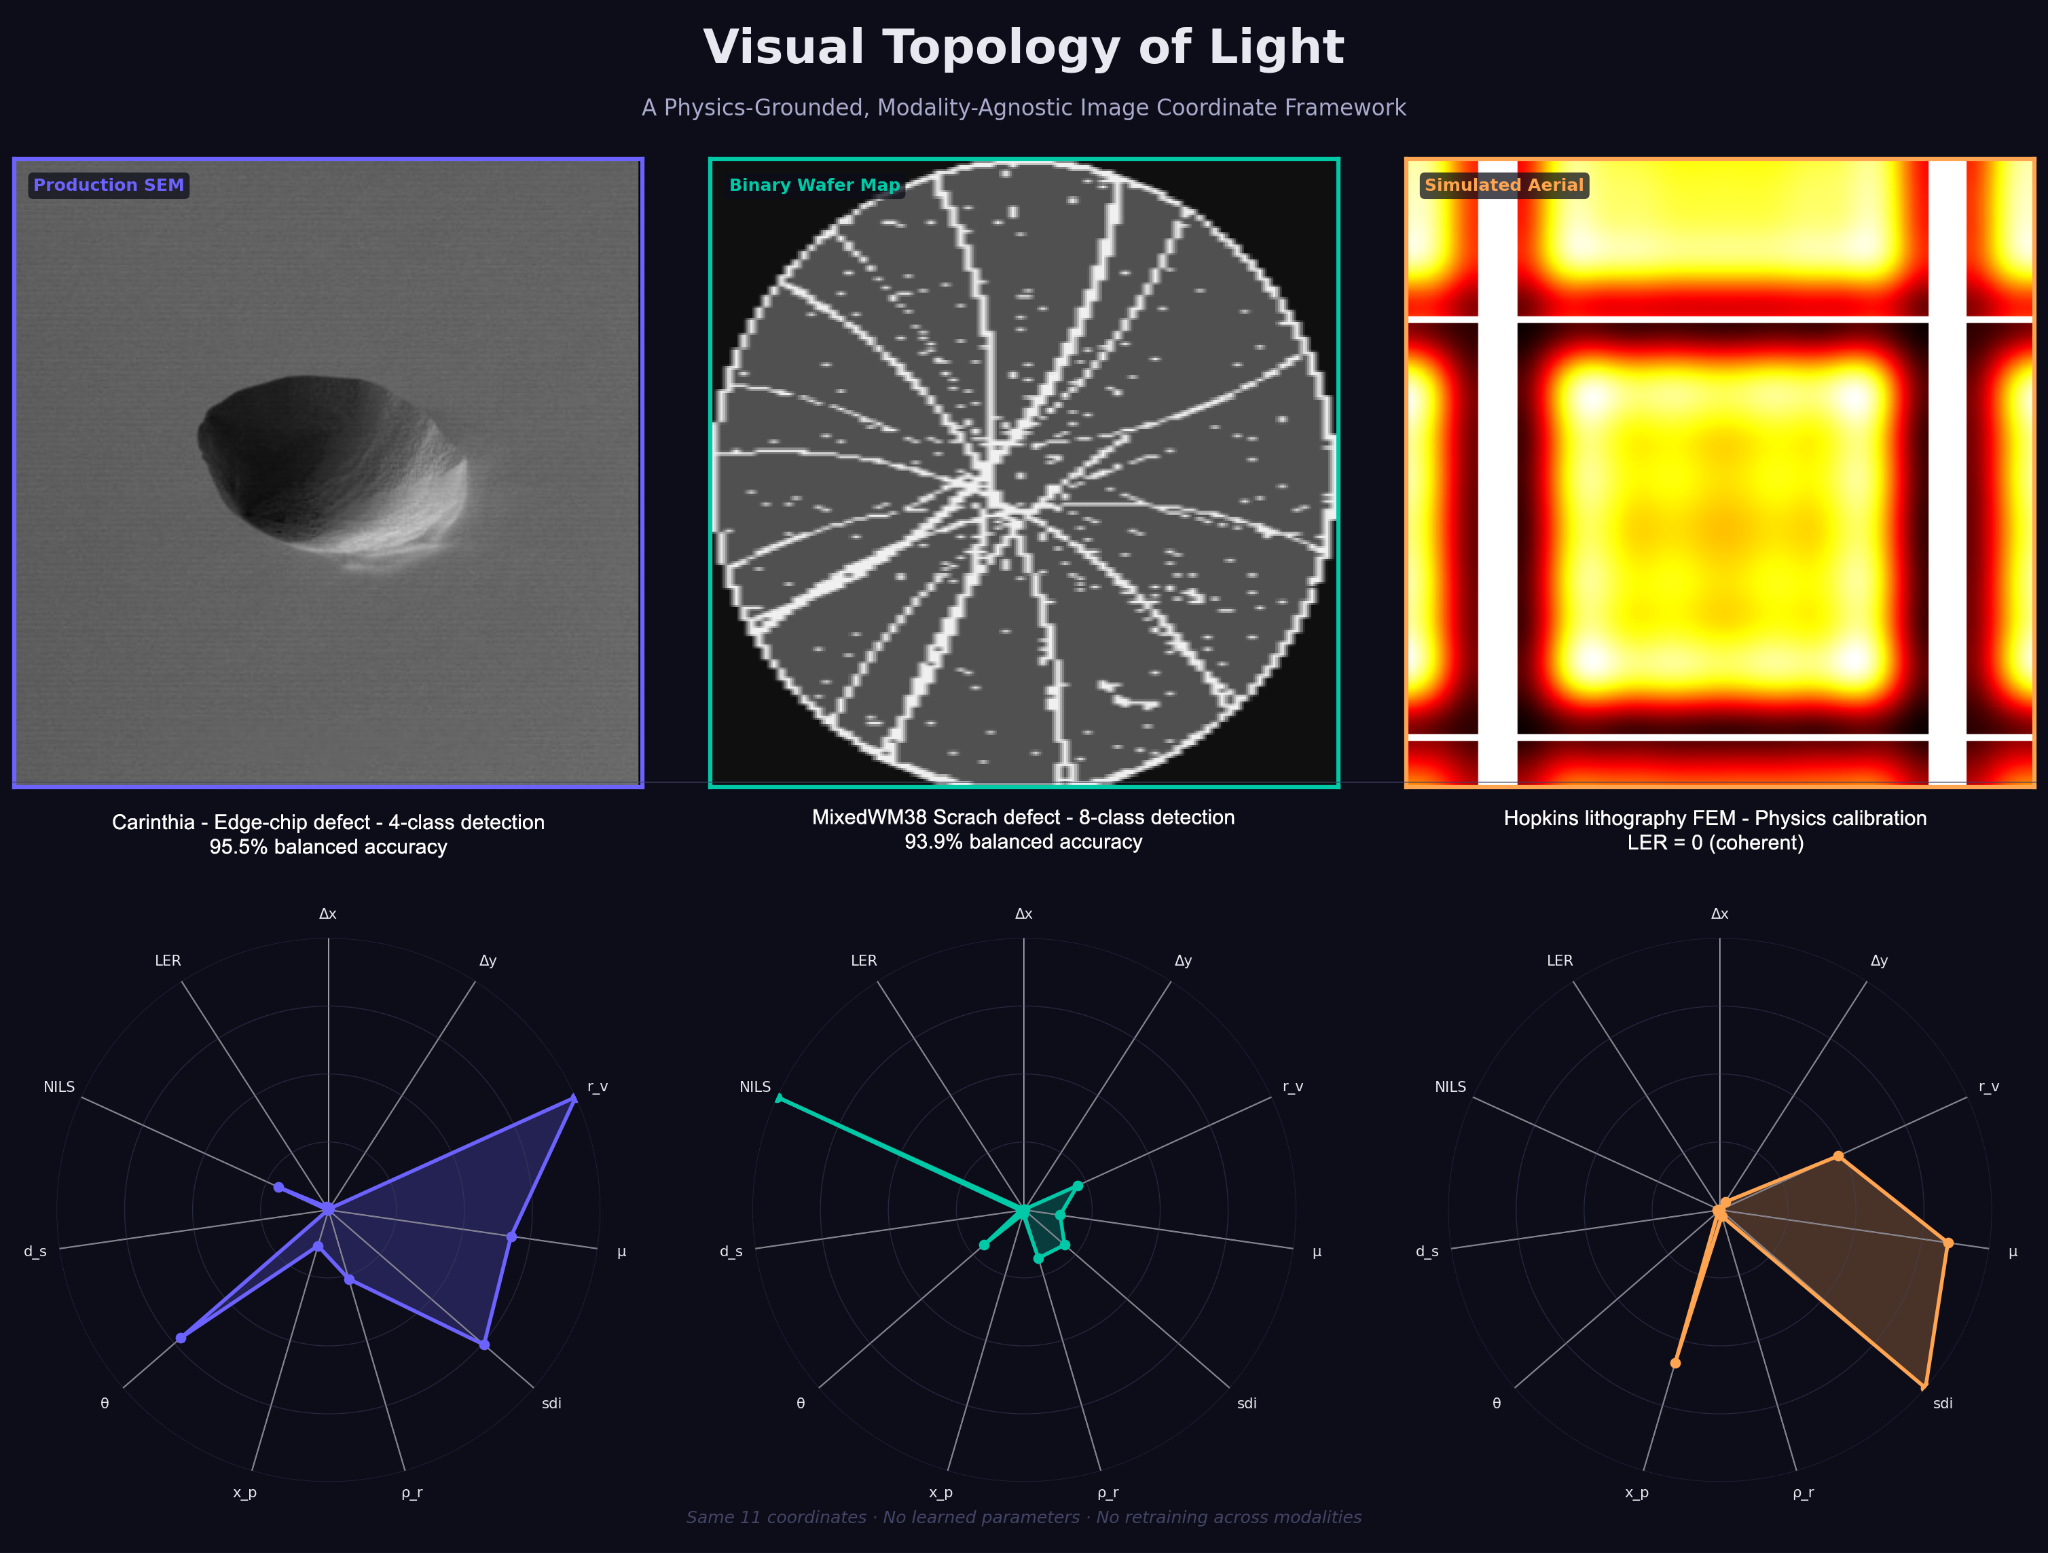
A physics-grounded, modality-agnostic image coordinate framework for semiconductor process monitoring. 15 coordinates. No learned parameters. Cold transfer across SEM, wafer maps, and aerial simulation.
METHOD
The strongest evidence is not accuracy.
It is the prediction that came true.
Semiconductor process monitoring generates imaging data across structurally distinct modalities: aerial images from lithography simulation, SEM images for metrology and defect review, and binary wafer maps from electrical test. Historically, each modality has required its own analysis pipeline. Deep learning has achieved strong per-domain results but requires large labeled datasets, modality-specific retraining when tools or layers change, and produces outputs that are opaque to process engineers who need to act on them.
We address a different question: can a fixed set of interpretable structural coordinates, derived from image formation physics rather than fitted to data, transfer across imaging modalities without retraining? If a coordinate is truly grounded in how images are formed, its behavior should change in the direction physics predicts as the image formation mechanism changes, not arbitrarily, and not because a training set reinforced a particular pattern.
VTL achieves competitive accuracy across both imaging modalities with the same coordinates and no retraining, while no other method in the comparison does. Second, the pattern of coordinate dominance across modalities is consistent with known image formation behavior. That consistency, pre-stated and then observed, is a stronger claim than a classification number.
15
coordinates derived from image formation physics, no learned parameters
93.4%
balanced accuracy on Carinthia production SEM — first among all baselines
0
retraining steps across three independent datasets spanning two imaging modalities
Pre-validation — before real data was examined
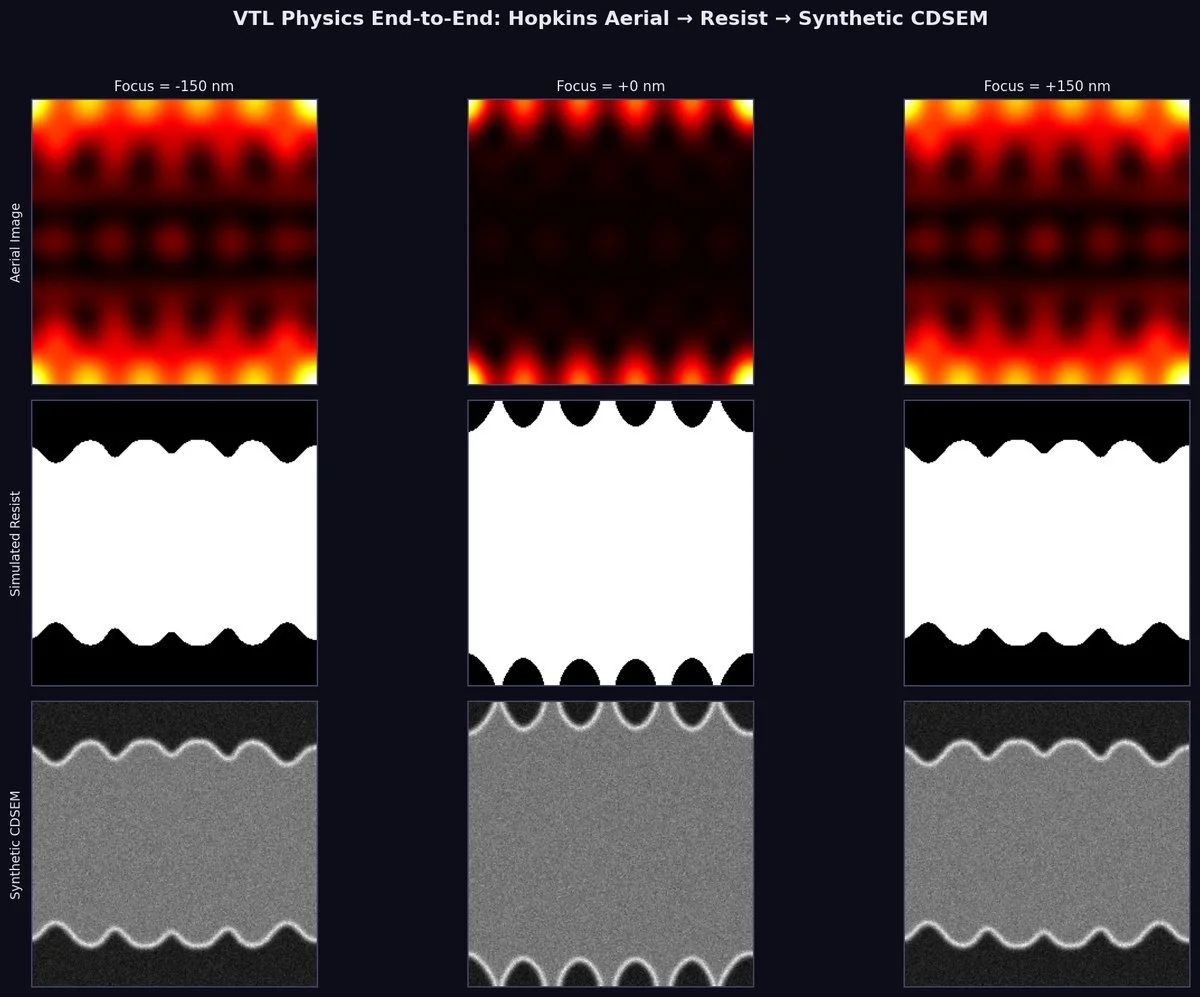
"LER must be identically zero on coherent aerial simulation images. Coherent defocus moves all edges uniformly without roughening them."
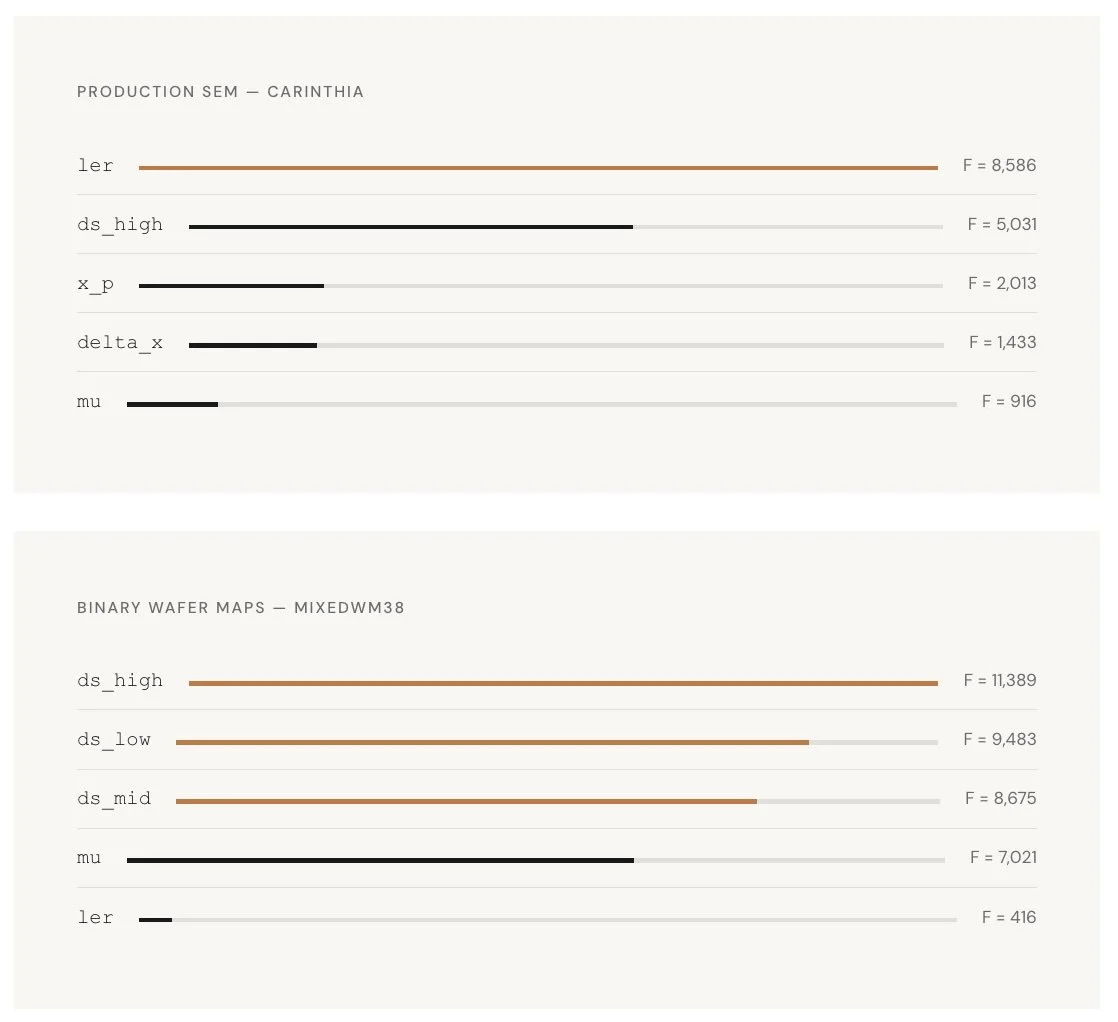
Confirmed. LER averages 0.000–0.001 across all focus levels on simulated aerial images. On synthetic CDSEM it rises to 0.004–0.006 — a 5–7× increase from Poisson shot noise and edge discretization. On production SEM it becomes the dominant discriminator (ANOVA F = 8,586). On binary wafer maps it recedes to approximately 11th place. The coordinate follows the expected physical pathway across four distinct image regimes without modification.
Figure. Three-stage pipeline at nominal focus. Left: Hopkins aerial image (LER ≈ 0). Center: resist pattern. Right: synthetic CDSEM with edge halos and Poisson shot noise (LER elevated 5–7×).
Cold Transfer
No Retraining Required
The same 15 coordinates, identically defined, transfer from simulated aerial images to production SEM defect classification to binary wafer maps. When the imaging modality changes, the dominant coordinate changes — not the coordinate definitions.
Modality Shift
Hierarchy Reorganizes, Not Redesigns
LER dominates production SEM (F = 8,586). Spectral band coordinates dominate wafer maps (F = 11,389 / 9,483 / 8,675). The shift is consistent with image formation physics — a physical prediction, not a dataset artifact.
Operational Value
A Consistent Interpretive Language
When a fab brings up a new inspection tool, a learned classifier retrains. VTL reorganizes. A process engineer reading NILS and LER on a new tool reads the same quantities, defined the same way, as on the previous tool.
Negative Result
Perona-Malik Has No Effect
Anisotropic diffusion pre-processing produces statistically indistinguishable results (95.7% vs 95.7%, CI overlap >99%). VTL operates above the SEM grain noise floor at 480×480. LER and NILS are measuring real structural properties.
Feature Efficiency
15 Coordinates vs 1,764
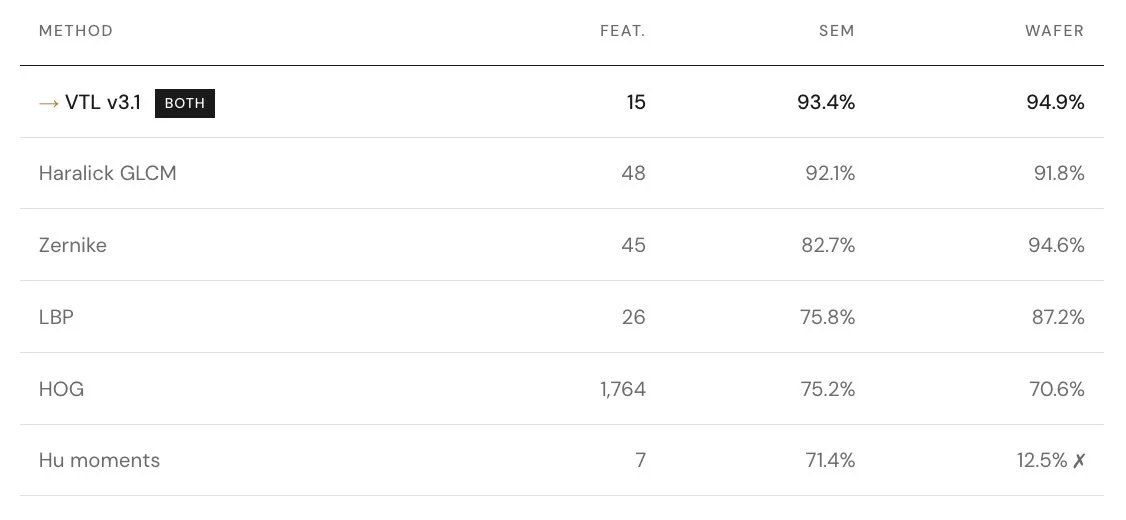
VTL matches or beats Haralick GLCM (48 features), Zernike (45), LBP (26), HOG (1,764), and Hu moments (7) across both modalities simultaneously. No other method maintains competitive performance on both SEM and wafer maps.
Hu Moments
The Cross-Modality Failure Case
Hu moments achieve 71.4% balanced accuracy on Carinthia SEM and collapse to exactly chance (12.5%) on MixedWM38 wafer maps — consistent with their assumption of continuous intensity distributions, which binary wafer maps violate.
Framework
15 Coordinates, One Intensity Map
All coordinates computed from a single normalized intensity map I ∈ [0,1], min-max normalized to grayscale. No learned parameters at any stage. The v1 kernel (9 coordinates) forms the spatial geometry foundation. v2 adds NILS. v3 adds LER. v3.1 adds edge density and spectral band decomposition — the three spectral coordinates rank 1st–3rd on wafer maps by ANOVA F-statistic. Coordinates:
delta_x: Centroid X offset from image center
delta_y: Centroid Y offset from image center
r_vRadial: variance of intensity mass
mu: Mean intensity — encodes defect density
sdi: Normalized Shannon entropy of histogram
rho_r: Radial correlation: bright center vs periphery
x_p: Peak X offset from centroid
theta: Dominant gradient orientation
d_s: Spectral spread — center of FFT mass
nils: Edge sharpness (NILS) — focus indicator
ler: Edge roughness — stochastic process variation
edge_density: Canny edge fraction — structural complexity
ds_low: Low-frequency spectral power
ds_mid: Mid-frequency spectral power
ds_high: High-frequency spectral power
The Central Observation
Same coordinates. Different physics. Different hierarchy.
The coordinate ranking shifts systematically with modality in a pattern consistent with image formation physics. A physical prediction, not a dataset artifact — the coordinate set is fixed, but what it finds informative changes with the mechanism of image formation.
Results
Baseline Comparison — Two Modalities
Identical protocol: StandardScaler + SVM probe + 5-fold stratified CV, balanced accuracy. VTL v3.1 is the only method that ranks first on both modalities with the same 15 coordinates and no retraining.
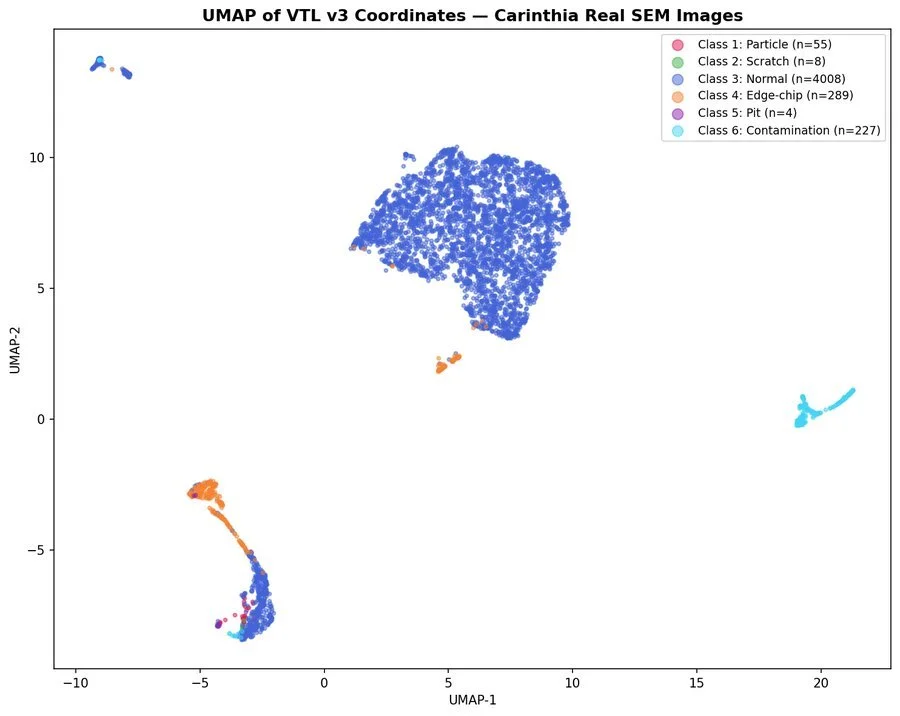
Figure. UMAP projection of VTL v3.1 coordinates for 4,579 Carinthia production SEM images. All four defect classes form well-separated clusters — zero-parameter visualization of coordinate space structure.
Coordinate Stability Under Imaging Conditions
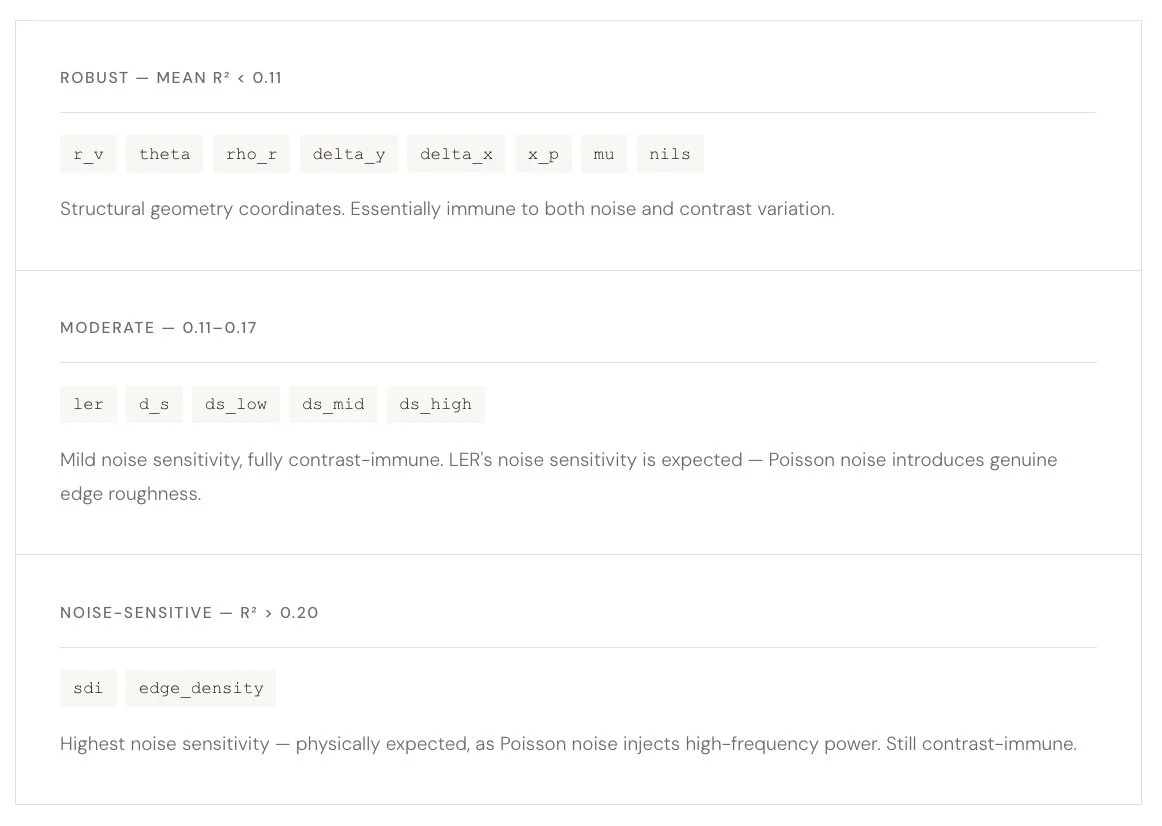
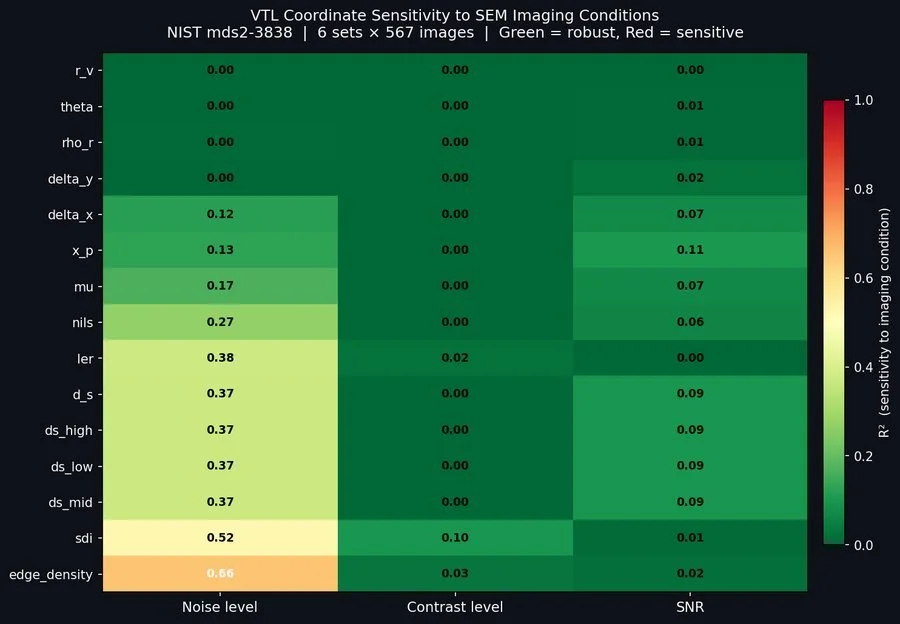
Validated against 3,402 NIST mds2-3838 simulated SEM images at 27 noise levels and 21 contrast levels. All 15 coordinates are contrast-immune (R²/contrast < 0.10).
Figure. VTL coordinate sensitivity heatmap — NIST mds2-3838 (3,402 simulated SEM images). R² of each coordinate against noise, contrast, and SNR. Green = robust, red = sensitive. All coordinates show R²/contrast < 0.10.
Paper
Visual Topology of Light v3.2
24 pages. 13 figures. 9 tables. All results reproduced from executed Jupyter notebooks.
Status: research preprint. Public structural evidence. Overlay correlation untested — no public dataset pairing SEM images with overlay measurements currently exists.
Related Work
PTD-Z: Pattern Topology: Drift Monitor
The same measurement kernel applied to a different problem: routed structural telemetry for semiconductor-like inspection imagery. PTD-Z asks whether an organized pattern has stopped behaving like the structure it was expected to be — decomposing image evidence into interpretable routes, testing residual signal against classical baselines, and refusing process-causal claims without process-linked data.
Where VTL is a coordinate framework, PTD-Z is a signal router with explicit refusal logic. Two instantiations of the same underlying methodology.