Catch Compositional Drift Before It Reaches Production
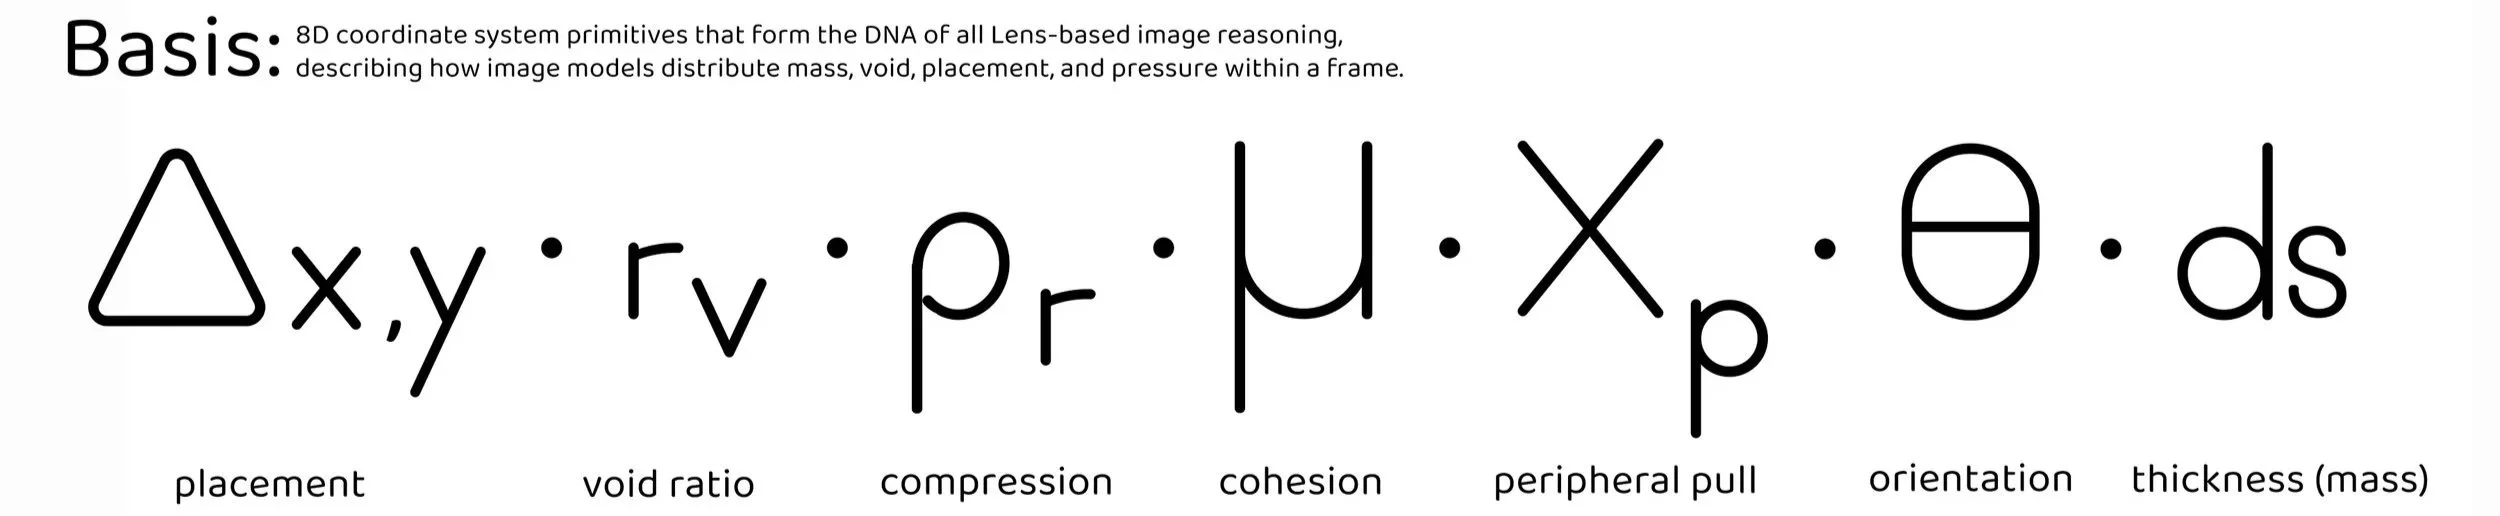
VTL Kernel Metrics detects when AI models change behavior, without model access, training data, or human review. Automated regression testing for generative systems.
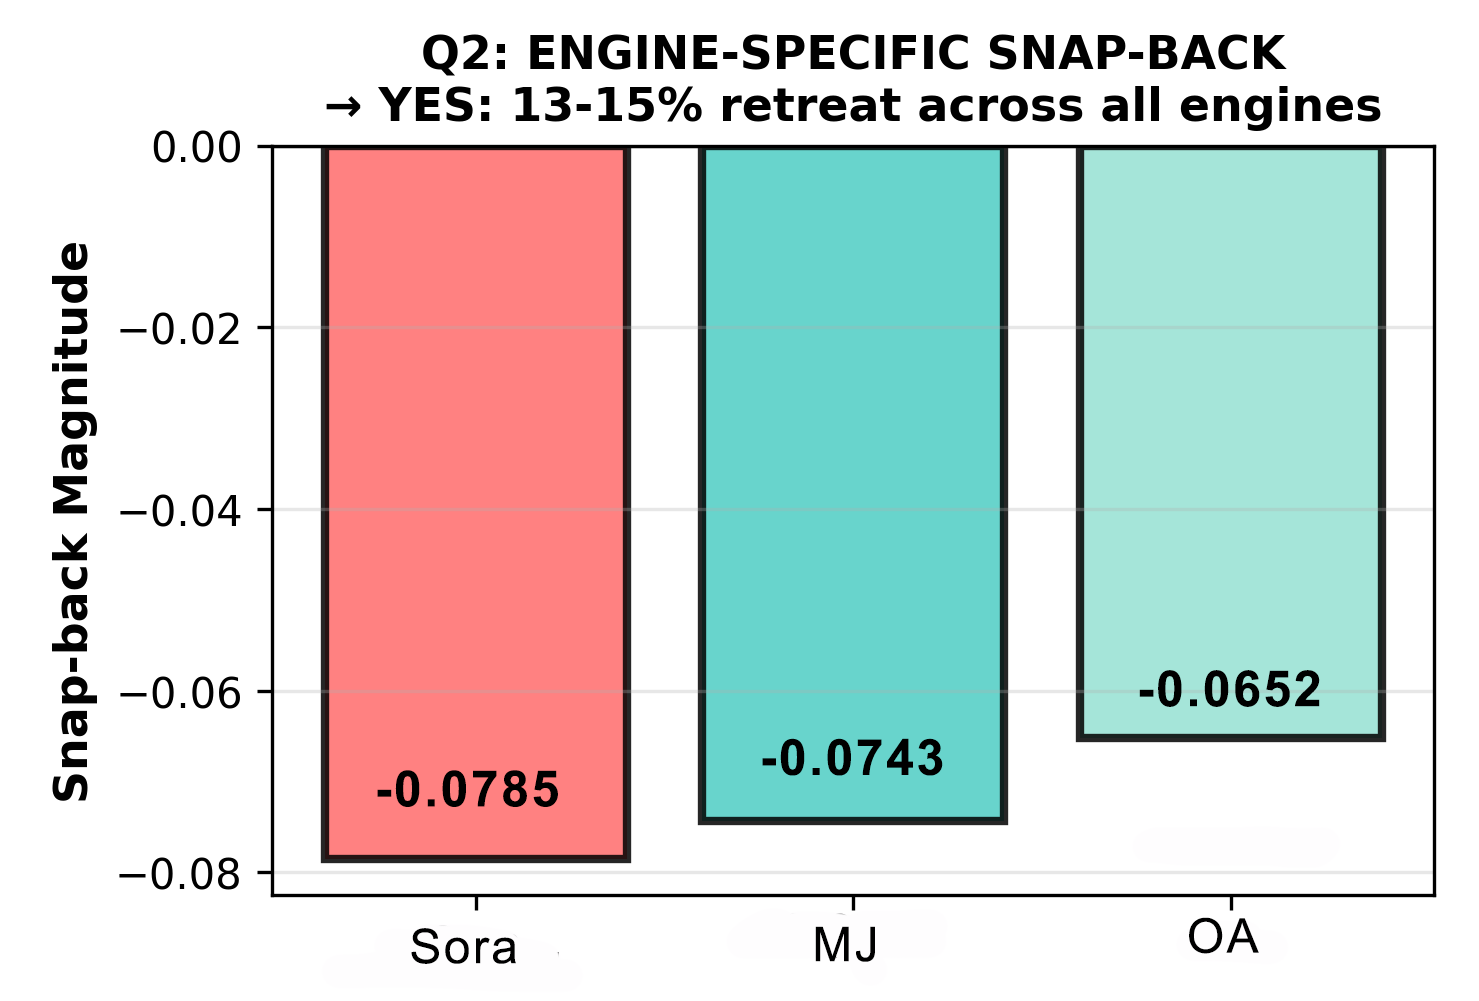
13-15%
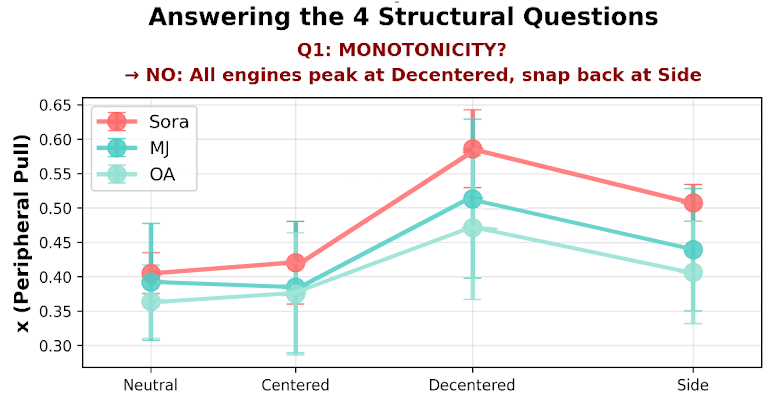
observable snap-back across Sora, MJ and OA.
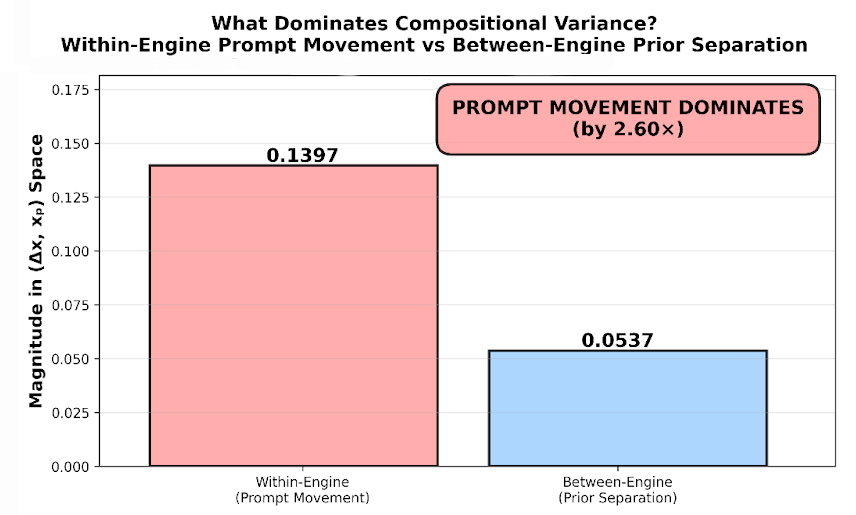
2.6×
Prompt movement dominates engine separation
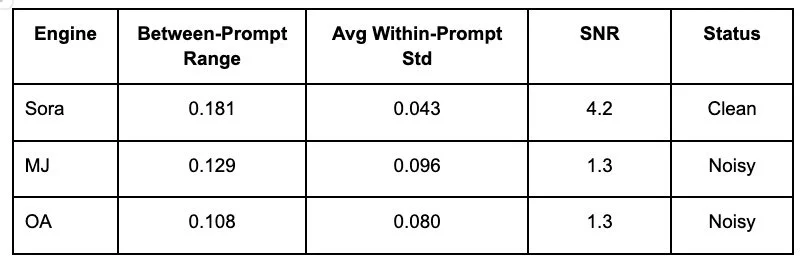
4.2 | 1.3
Signal-to-noise: Sora | MJ/OA
The Gap in Generative Model Evaluation
Drift detection is a known gap in current model evaluation. Red teams need reproducible, quantitative tests, not subjective review. Alignment researchers need distribution shift monitors. Safety teams need to answer critical questions that current tools can't address.
Question 1:
Can this detect if an image changed compositional behavior?
Question 2:
Can we use this to flag unusual outputs in production?
Question 3:
How sensitive is this image to mode collapse?
Current approaches rely on human review or semantic analysis. Both are slow, subjective, and miss structural patterns.
VTL is a geometric measurement system that detects when model outputs shift outside normal structural basins, without requiring model access, training data, or semantic analysis. It enables automated regression testing, mode collapse detection, and anomaly flagging for production AI systems.
What the Data Reveals
Evidence from 432 images across three engines, four prompt conditions, three aspect ratios
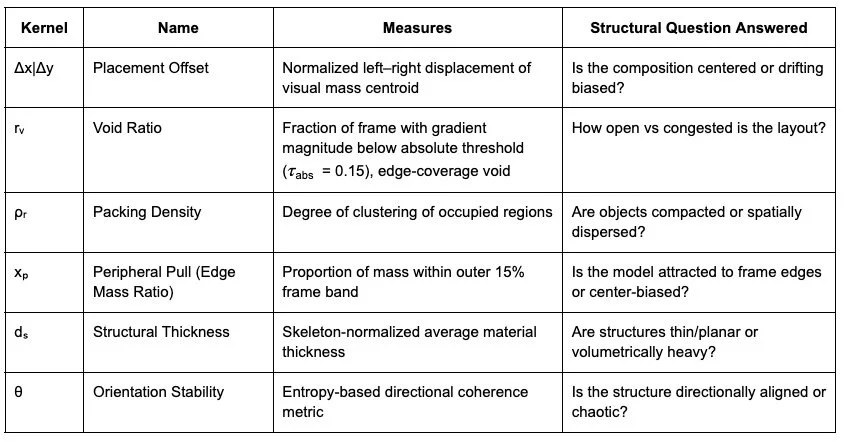
Finding #1: The 13-15% Snap-Back Constraint
When prompted to place objects "to one side of the frame," all three engines resisted, retreating 13-15% back toward center from their maximum dispersion. This snap-back reveals the boundary and strength of each model's compositional attractor basin—a measurable structural constraint that resists user instructions.
Models have measurable structural constraints that resist user instructions. This is detectable without model access and can be monitored for drift. If snap-back increases from 14% to 20% in a model update, spatial controllability has degraded.
Finding #2: Prompt Movement Dominates Engine Separation (2.6×)
Prompt-induced coordinate shifts are 2.6× larger than engine-to-engine baseline differences. This means VTL measures behavioral response (controllability), not just behavioral bias (defaults). When you change prompts within an engine, coordinates move by 0.14 units. When you change engines for the same prompt, coordinates move by only 0.05 units.
VTL can detect when prompt responsiveness degrades. If the 2.6× ratio drops to 1.5× in a model update, controllability has decreased by ~42%. This ratio quantifies 'prompt following fidelity. Monitoring thresholds:
Baseline: 2.6× (±0.3)
Warning threshold: <2.0× (23% degradation)
Critical threshold: <1.5× (42% degradation)
Finding #3: Signal-to-Noise Varies by Engine
Signal-to-noise ratio quantifies how much prompt-induced movement exceeds within-prompt variance. Sora exhibits clean, consistent outputs (SNR = 4.2), while MJ and OA show higher noise (SNR = 1.3). This affects sample size requirements for reliable regression detection—Sora needs only n=20 images per condition for 80% statistical power, while MJ/OA require n=50.
Safety implication: detection sensitivity depends on engine characteristics. High SNR engines (Sora) enable real-time monitoring with small samples. Low SNR engines (MJ/OA) require larger test sets for reliable regression detection.
Summary
Three Applications for Safety Teams
Use Case 1: Model Update Regression Detection
Problem: Foundation model teams ship updates constantly but don't test for subtle behavioral drift.
VTL Approach: Generate standardized test set, extract kernel coordinates, compare against baseline distribution, flag if coordinates shift beyond threshold.
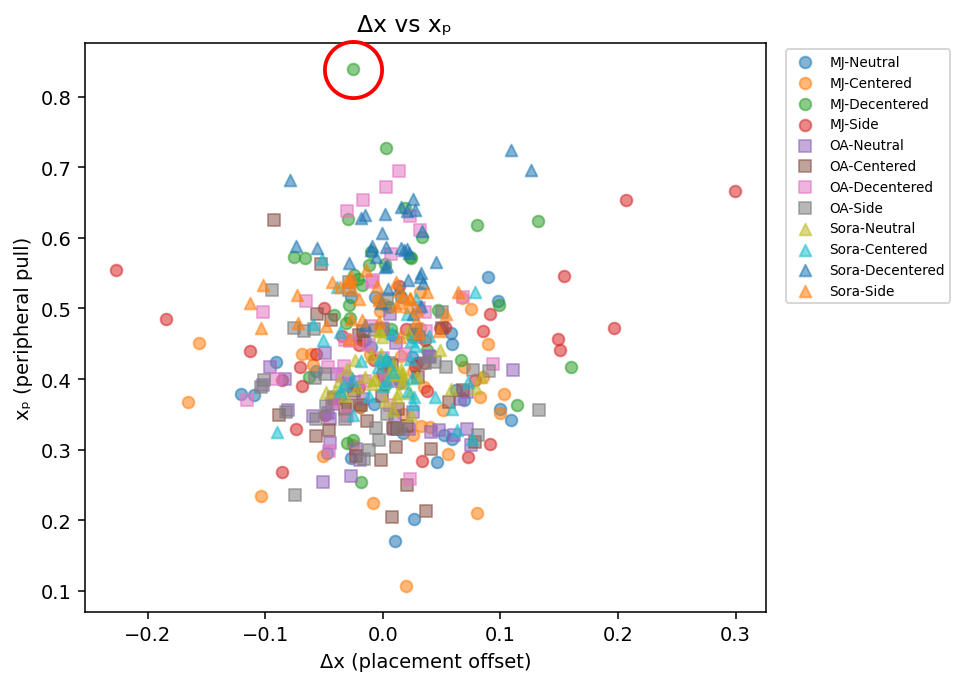
Example scenario: Post-update test generates images with xₚ = 0.85 (MJ). This is 4.8σ above baseline (0.405). → FLAG: Compositional behavior has shifted → INVESTIGATE: What changed?
Value:
Automated (no human review needed)
Objective (not taste-based)
Fast (run on every build)
Sensitive (detects 2σ shifts)
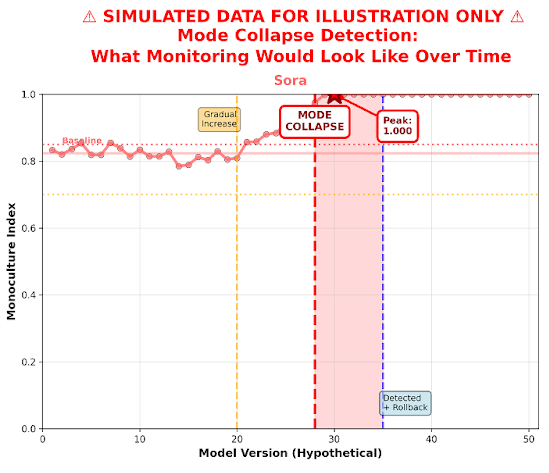
Use Case 2: Monoculture / Mode Collapse Detection
Problem: Models sometimes collapse into repetitive outputs. Images still look good individually and semantic content varies, but structural diversity is lost.
VTL Approach: Generate N images from same prompt class, extract kernel coordinates, measure structural diversity, compare against expected baseline.
Monoculture Index explanation box:
MI = 1 - (normalized variance)
Scale: 0 (diverse) to 1 (identical)
Thresholds: MI increase >0.10 = FLAG, >0.15 = CRITICAL
Value bullets:
Detects mode collapse without semantic analysis
Works across content types
Quantitative (not subjective)
Continuous monitoring
Use Case 3: Prompt Injection / Adversarial Robustness
Problem: Users can craft prompts that push models into unusual behavioral regimes. Safety teams need to know what's normal, when prompts push into unusual territory, and how far adversarial prompts can move structural behavior.
VTL Approach: Define "normal" compositional basin from benign prompts, flag outputs that fall outside this basin, measure distance from baseline coordinates.
Detects unusual regime without keyword analysis
Quantifies "how unusual"
Reveals model behavioral constraints
Normal basin boundaries box:
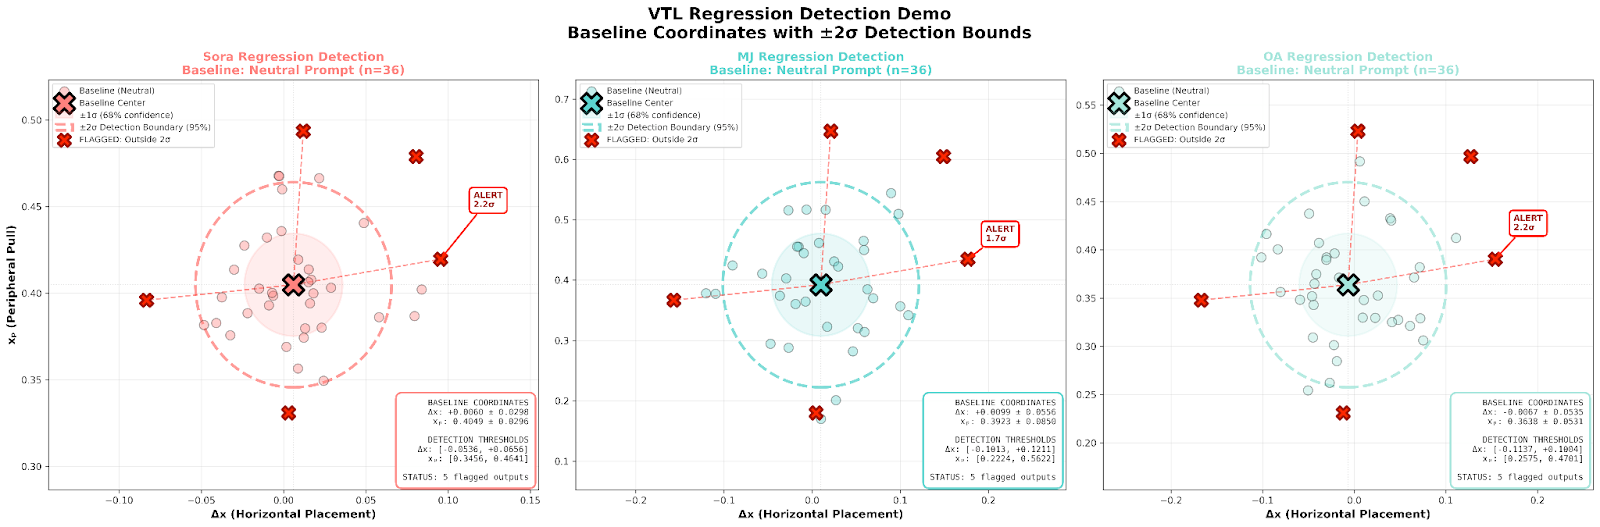
Sora: xₚ ∈ [0.375, 0.450] (95% confidence)
MJ: xₚ ∈ [0.300, 0.480]
OA: xₚ ∈ [0.280, 0.460]
"Decentered" pushes outside → "Side" attempts to push further but SNAPS BACK.
Structural anomaly detector framework:
Baseline: normal operational range
Runtime: extract kernels from each generated image
Score: distance from baseline centroid
Threshold: flag if distance > 3σ

The Snap-Back: Measurable Behavioral Constraints
This tested whether image generators follow explicit spatial instructions. When instructed to place objects 'to one side of the frame', all three engines resisted, retreating 13-15% back toward center from their maximum dispersion. This snap-back reveals the boundary and strength of each model's compositional attractor basin.
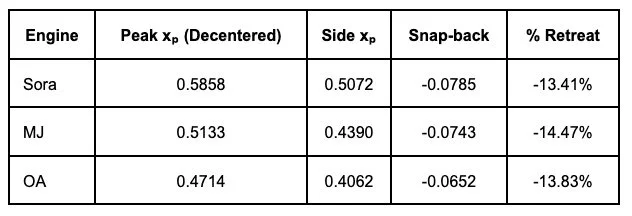
Mean snap-back: -0.0727 (±0.0067) Mean % retreat: -13.90% (±0.56%)
Three Consequences
1. PROMPT FOLLOWING LIMITS
Models do NOT follow instructions beyond basin boundaries
Users think they have control, but they don't
This is a faithfulness failure
2. BEHAVIORAL PREDICTABILITY
Snap-back is consistent (13-15% across engines)
Adversaries can probe for basin boundaries
Red teams can test resistance magnitude
3. CONTROL ILLUSION
Users write "place objects to one side"
Models peak at "toward edges" instead
This is misalignment between intent and execution
1. Content Safety Filters (semantic)
They detect: hate speech, violence, CSAM, policy violations
VTL adds: behavioral drift detection for safety systems themselves
Example: "Did the content filter's visual output patterns change post-update?"
2. Concept Detection Systems (semantic)
They detect: specific objects, people, copyrighted material
VTL adds: structural patterns in how concepts are arranged
Example: "Does the model always place detected faces in center?"
VTL in Context: Infrastructure, Not Replacement
A structural layer that other systems don't measure. It works alongside existing safety infrastructure.
3. Quality Metrics (aesthetic/technical)
They detect: blur, artifacts, resolution issues, aesthetic scoring
VTL adds: compositional consistency measurement
Example: "Did image quality improve but compositional diversity collapse?"
4. Interpretability Tools (mechanistic)
They detect: internal model behavior, attention patterns, neuron activation
VTL adds: external behavioral measurement (no model access required)
Example: "Model internals unchanged, but output structure shifted—why?"
Foundation models have structural constraints that safety teams can't currently measure. We built a system that reveals them through geometric analysis, without model access or training data. The system enables three things safety teams need: regression detection on every model update, mode collapse quantification, and anomaly flagging for unusual outputs.
It's deterministic, reproducible, and ready for deployment.